
One-liner choropleths on the composed Portugal map (mainland + island
insets), rendered with ggplot2 or echarts4r. Returns the renderer's native
object – a ggplot you can extend with +, or an echarts4r widget you
can pipe into e_*() functions – with deliberately light styling.
Usage
plot_pt(
  data = NULL,
  value = NULL,
  level = "municipio",
  by = NULL,
  renderer = "ggplot",
  palette = NULL,
  na_color = "grey85",
  legend = TRUE,
  ...
)
Arguments
- data
NULL(blank map), a data.frame to join (requiresby), or an sf object returned byget_map().- value
Name of the column to fill by (a column of
data). Numeric columns get a continuous scale; character/factor columns a discrete one.NULLdraws boundaries only.- level
Administrative level, as in
get_map(). Ignored (detected) whendatais an sf map.- by
How to join a data.frame
data; seeget_map().- renderer
"ggplot"or"echarts".- palette
Fill palette: a vector of colors, or a single string naming a
grDevices::hcl.colors()palette (e.g."Blues 3","Viridis"). Defaults to"Viridis".- na_color
Fill for boundaries without a data value.
- legend
Logical. Show the fill legend?
- ...
Passed to
get_map()(islands,admin_vintage,nuts_vintage,fuzzy,aliases,client). Ignored whendatais already an sf map.
Input forms
plot_pt()– blank administrative map.plot_pt(df, value = "cases", by = "dtmn")– joinsdfonto the boundaries viaget_map()and fills byvalue.plot_pt(m, value = "cases")wheremis an sf returned byget_map()– renders an already-composed map directly. Build the map once, render it with several renderers.
Renderers
"ggplot"(default): returns aggplotobject. Suited to static reports; style further with+ theme(...),+ labs(...), etc."echarts": returns anecharts4rhtmlwidget with tooltip and roam enabled, suited to Shiny. Features are keyed internally by official code (not by name), so duplicate unit names (two "Lagoa" municipalities, 196 reused freguesia names) cannot mis-map values; tooltips show the display name. Style further with|> echarts4r::e_title(...), etc.
Examples
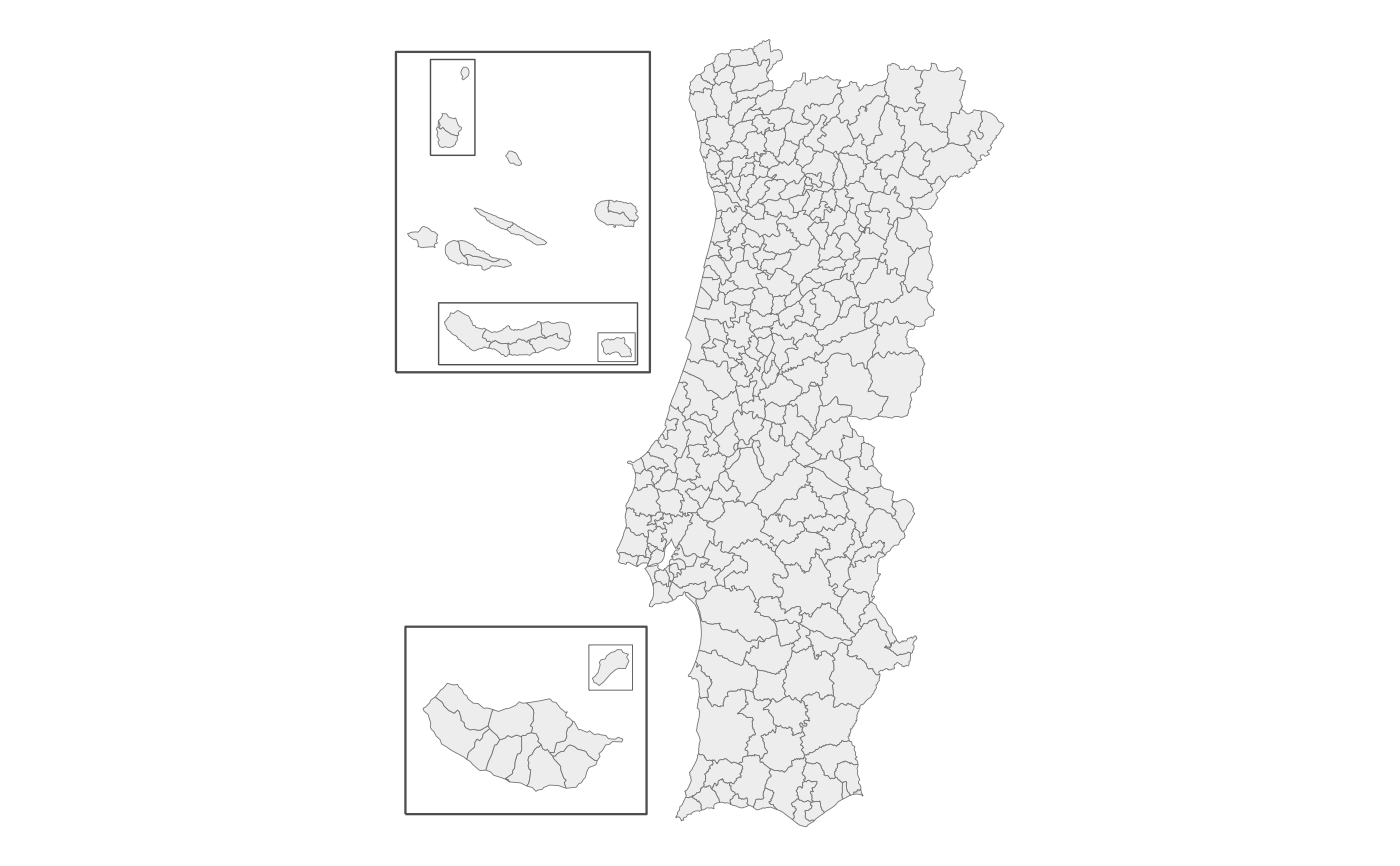
# blank municipality map
plot_pt()
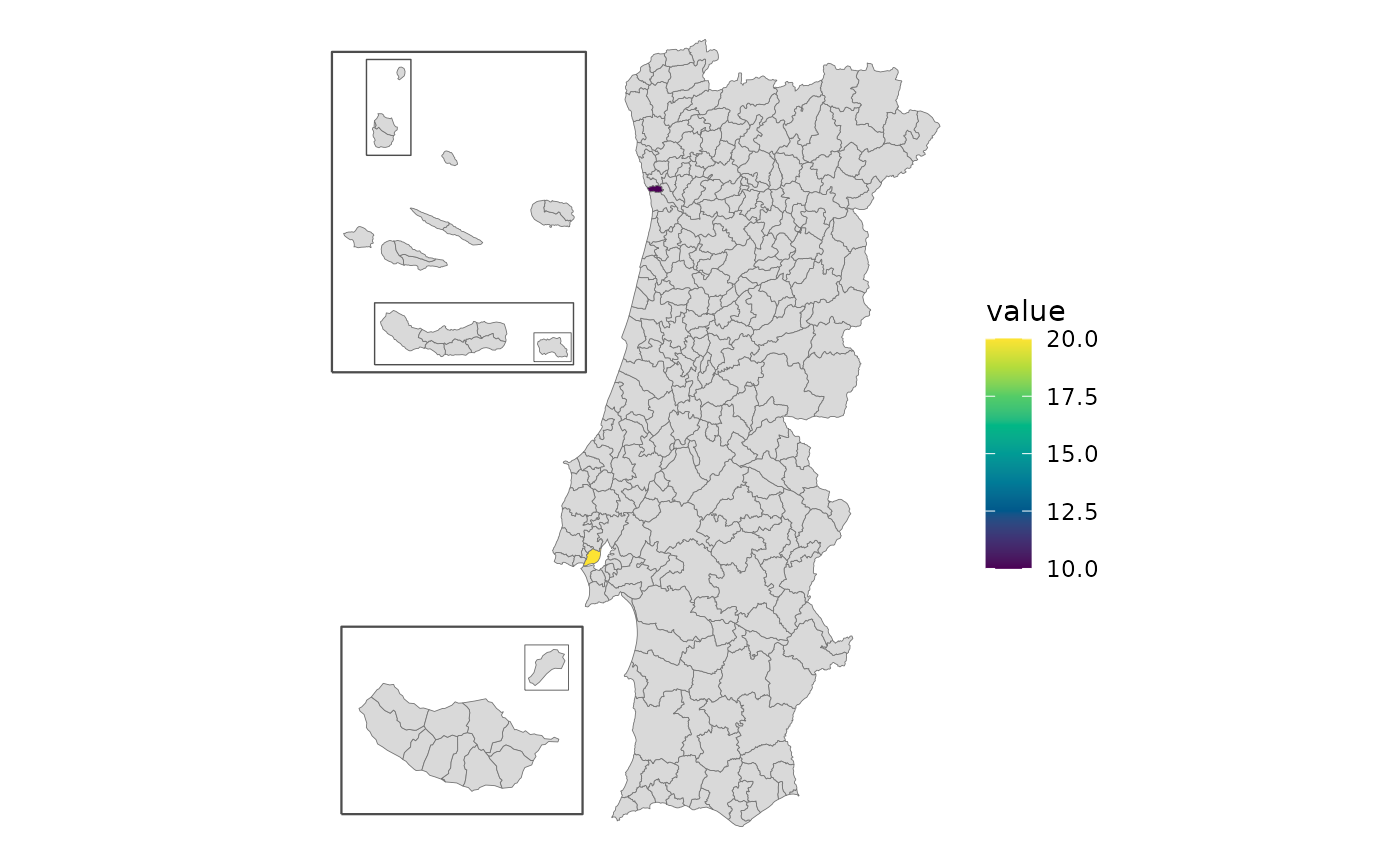
 df <- data.frame(concelho = c("Porto", "Lisboa"), value = c(10, 20))
plot_pt(df, value = "value", by = c(municipio = "concelho"))
#> get_map: 306 boundaries have no data row (NA fill).
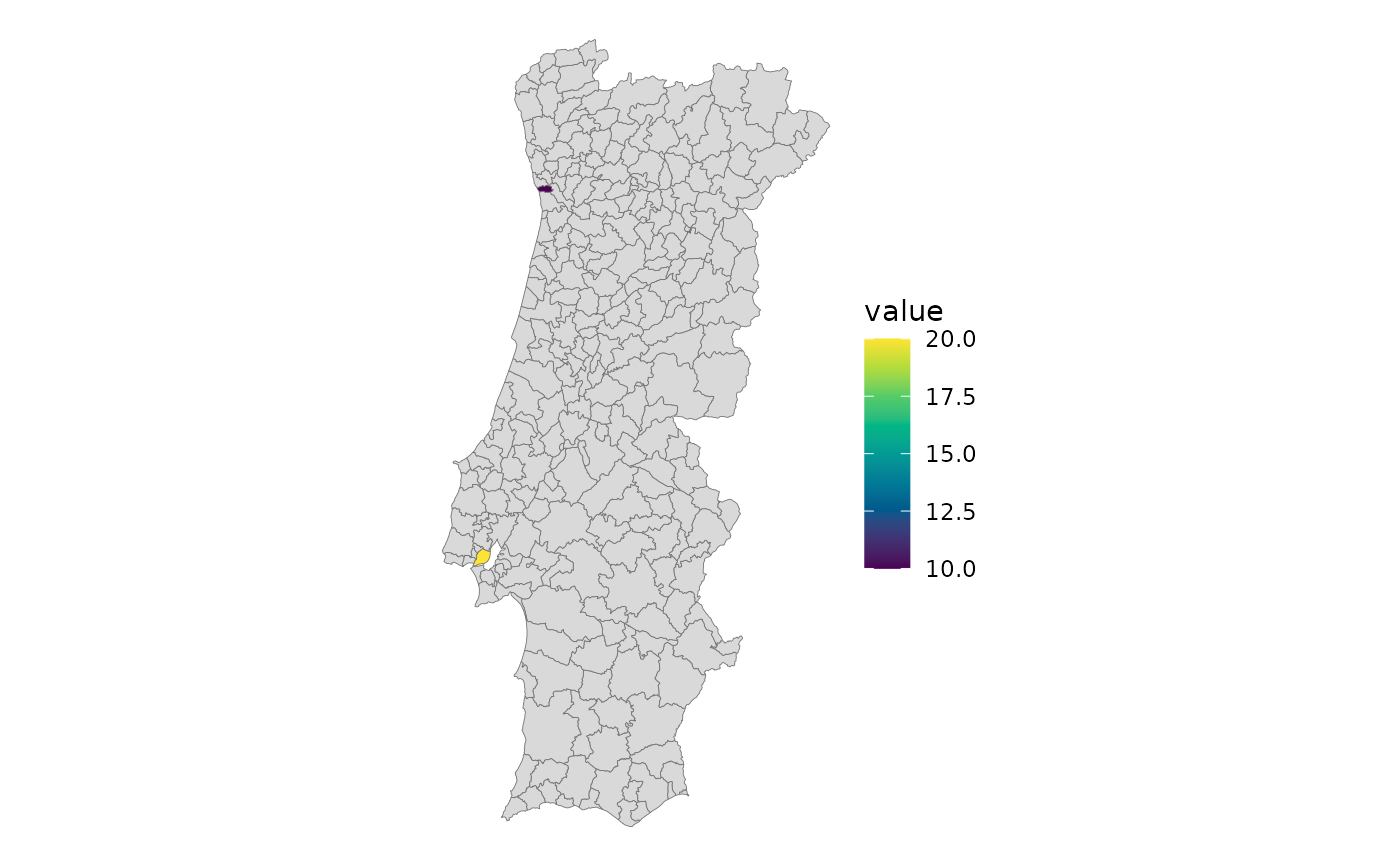
 plot_pt(df, value = "value", by = c(municipio = "concelho"), islands = "none")
#> get_map: 276 boundaries have no data row (NA fill).
 # Build once, render twice
m <- get_map("nuts3", islands = "box")
m$area_ha <- as.numeric(m$area_ha)
plot_pt(m, value = "area_ha")
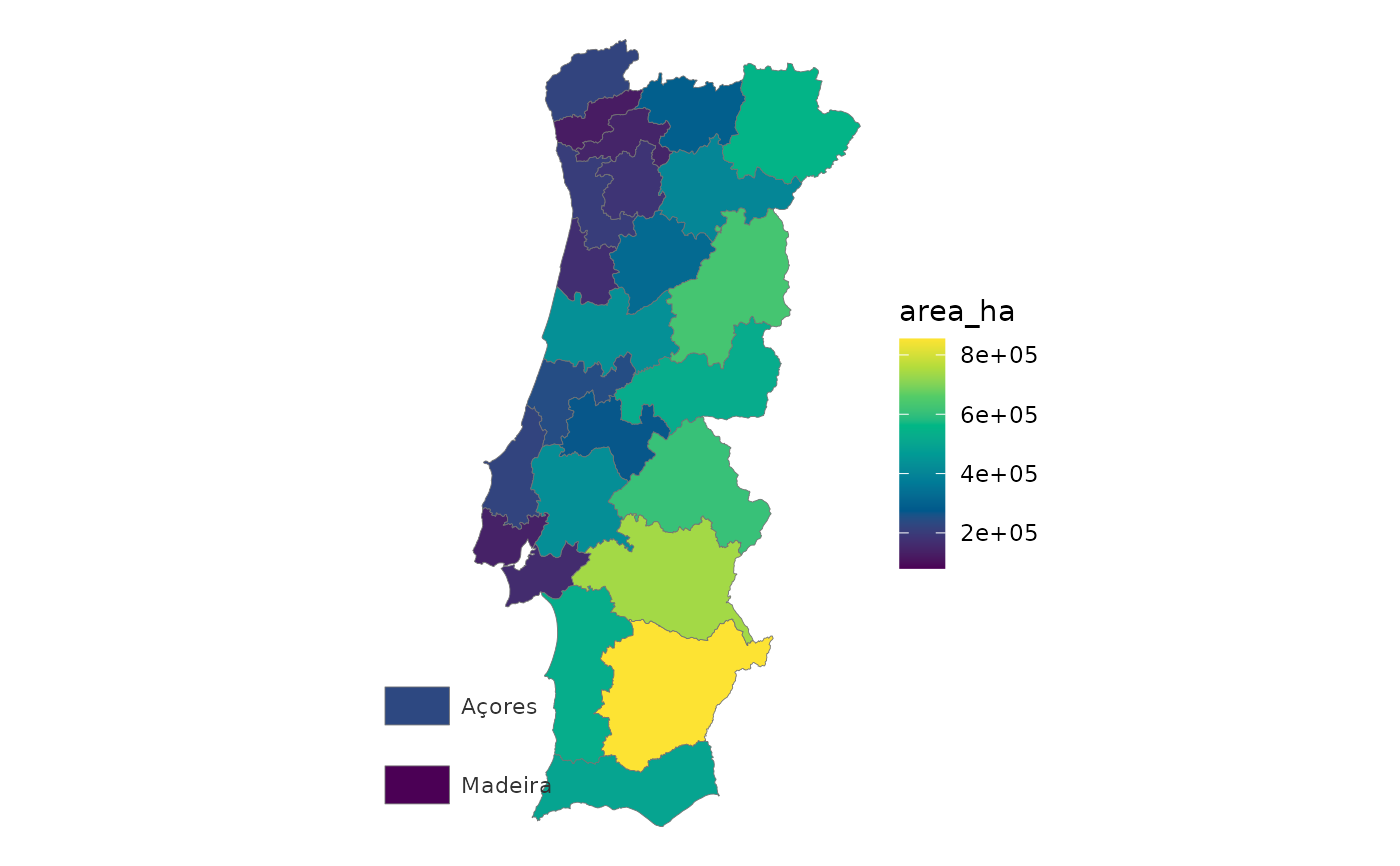 plot_pt(m, value = "area_ha", renderer = "echarts")