Interactive shiny
dashboards

Carlos Matos // ISPUP // November 2023

What is ?


  • An R package
  • Makes it easy to build interactive web apps from R

Note

Interactivity comes at a cost: some computer (the server) needs to be online to run the calculations and present the output.
Recently, the webR project made it possible to run code directly in the browser, without a dedicated server, but the technology is still in its infancy.

Anatomy of a shiny app

  • Contained in a single script called app.R
  • app.R has three components:
    • a user interface (ui) object
    • a server function
    • a call to the shinyApp function
library(shiny)

# See above for the definitions of ui and server
ui <- ...

server <- ...

shinyApp(ui = ui, server = server)

Run shiny::runExample(“01_hello”) in RStudio and explore the app.

Shiny widgets

Shiny syntax

  • somethingInput (e.g. sliderInput, textInput, …)
    • Display a widget that the user can control
    • happens in the ui
  • somethingOutput (e.g. plotOutput, textOutput, …)
    • Reacts to the user input and changes the output as needed
    • happens in the server
  • renderSomething (e.g. renderPlot, renderText, …)
    • Displays the results of the reactive output
    • happens in the ui

Reactivity

  • Means that outputs automatically update as inputs change.
  • Suppose you want to create an app to analyse the gapminder dataset, where the user controls the year.
#Creating a reactive object that takes the user input to filter for year
gapminder_filtered <-
  reactive(gapminder %>% 
             filter(year == input$year_input)
           )

Reactivity

  • If you wanted to call that object later, you would call it like a function, with ().
#| code-line-numbers: '4'
#Create a new reactive object, based on the gapminder_filtered dataset
#This object will obtain the lowest value of life expectancy for the filtered country
min_le <- 
  reactive(gapminder_filtered() %>% 
             filter(lifeExp == min(lifeExp)) %>% 
             pluck("lifeExp"))

Reactivity

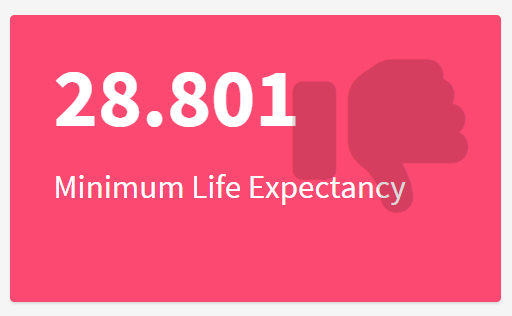
  • Finally, to display that value on a valueBox, for example:
renderValueBox({
  valueBox(
    value = min_le(),
    icon = "fa-thumbs-down",
    color = "danger")
})

Shiny “apps” the easy way

  • Flexdashboards
  • Interactive quarto documents
    • Quarto dashboards incoming in the next 1.4 release. Already available in pre-release.

Exercises