Welcome to the
tidyverse

Carlos Matos // ISPUP // November 2023

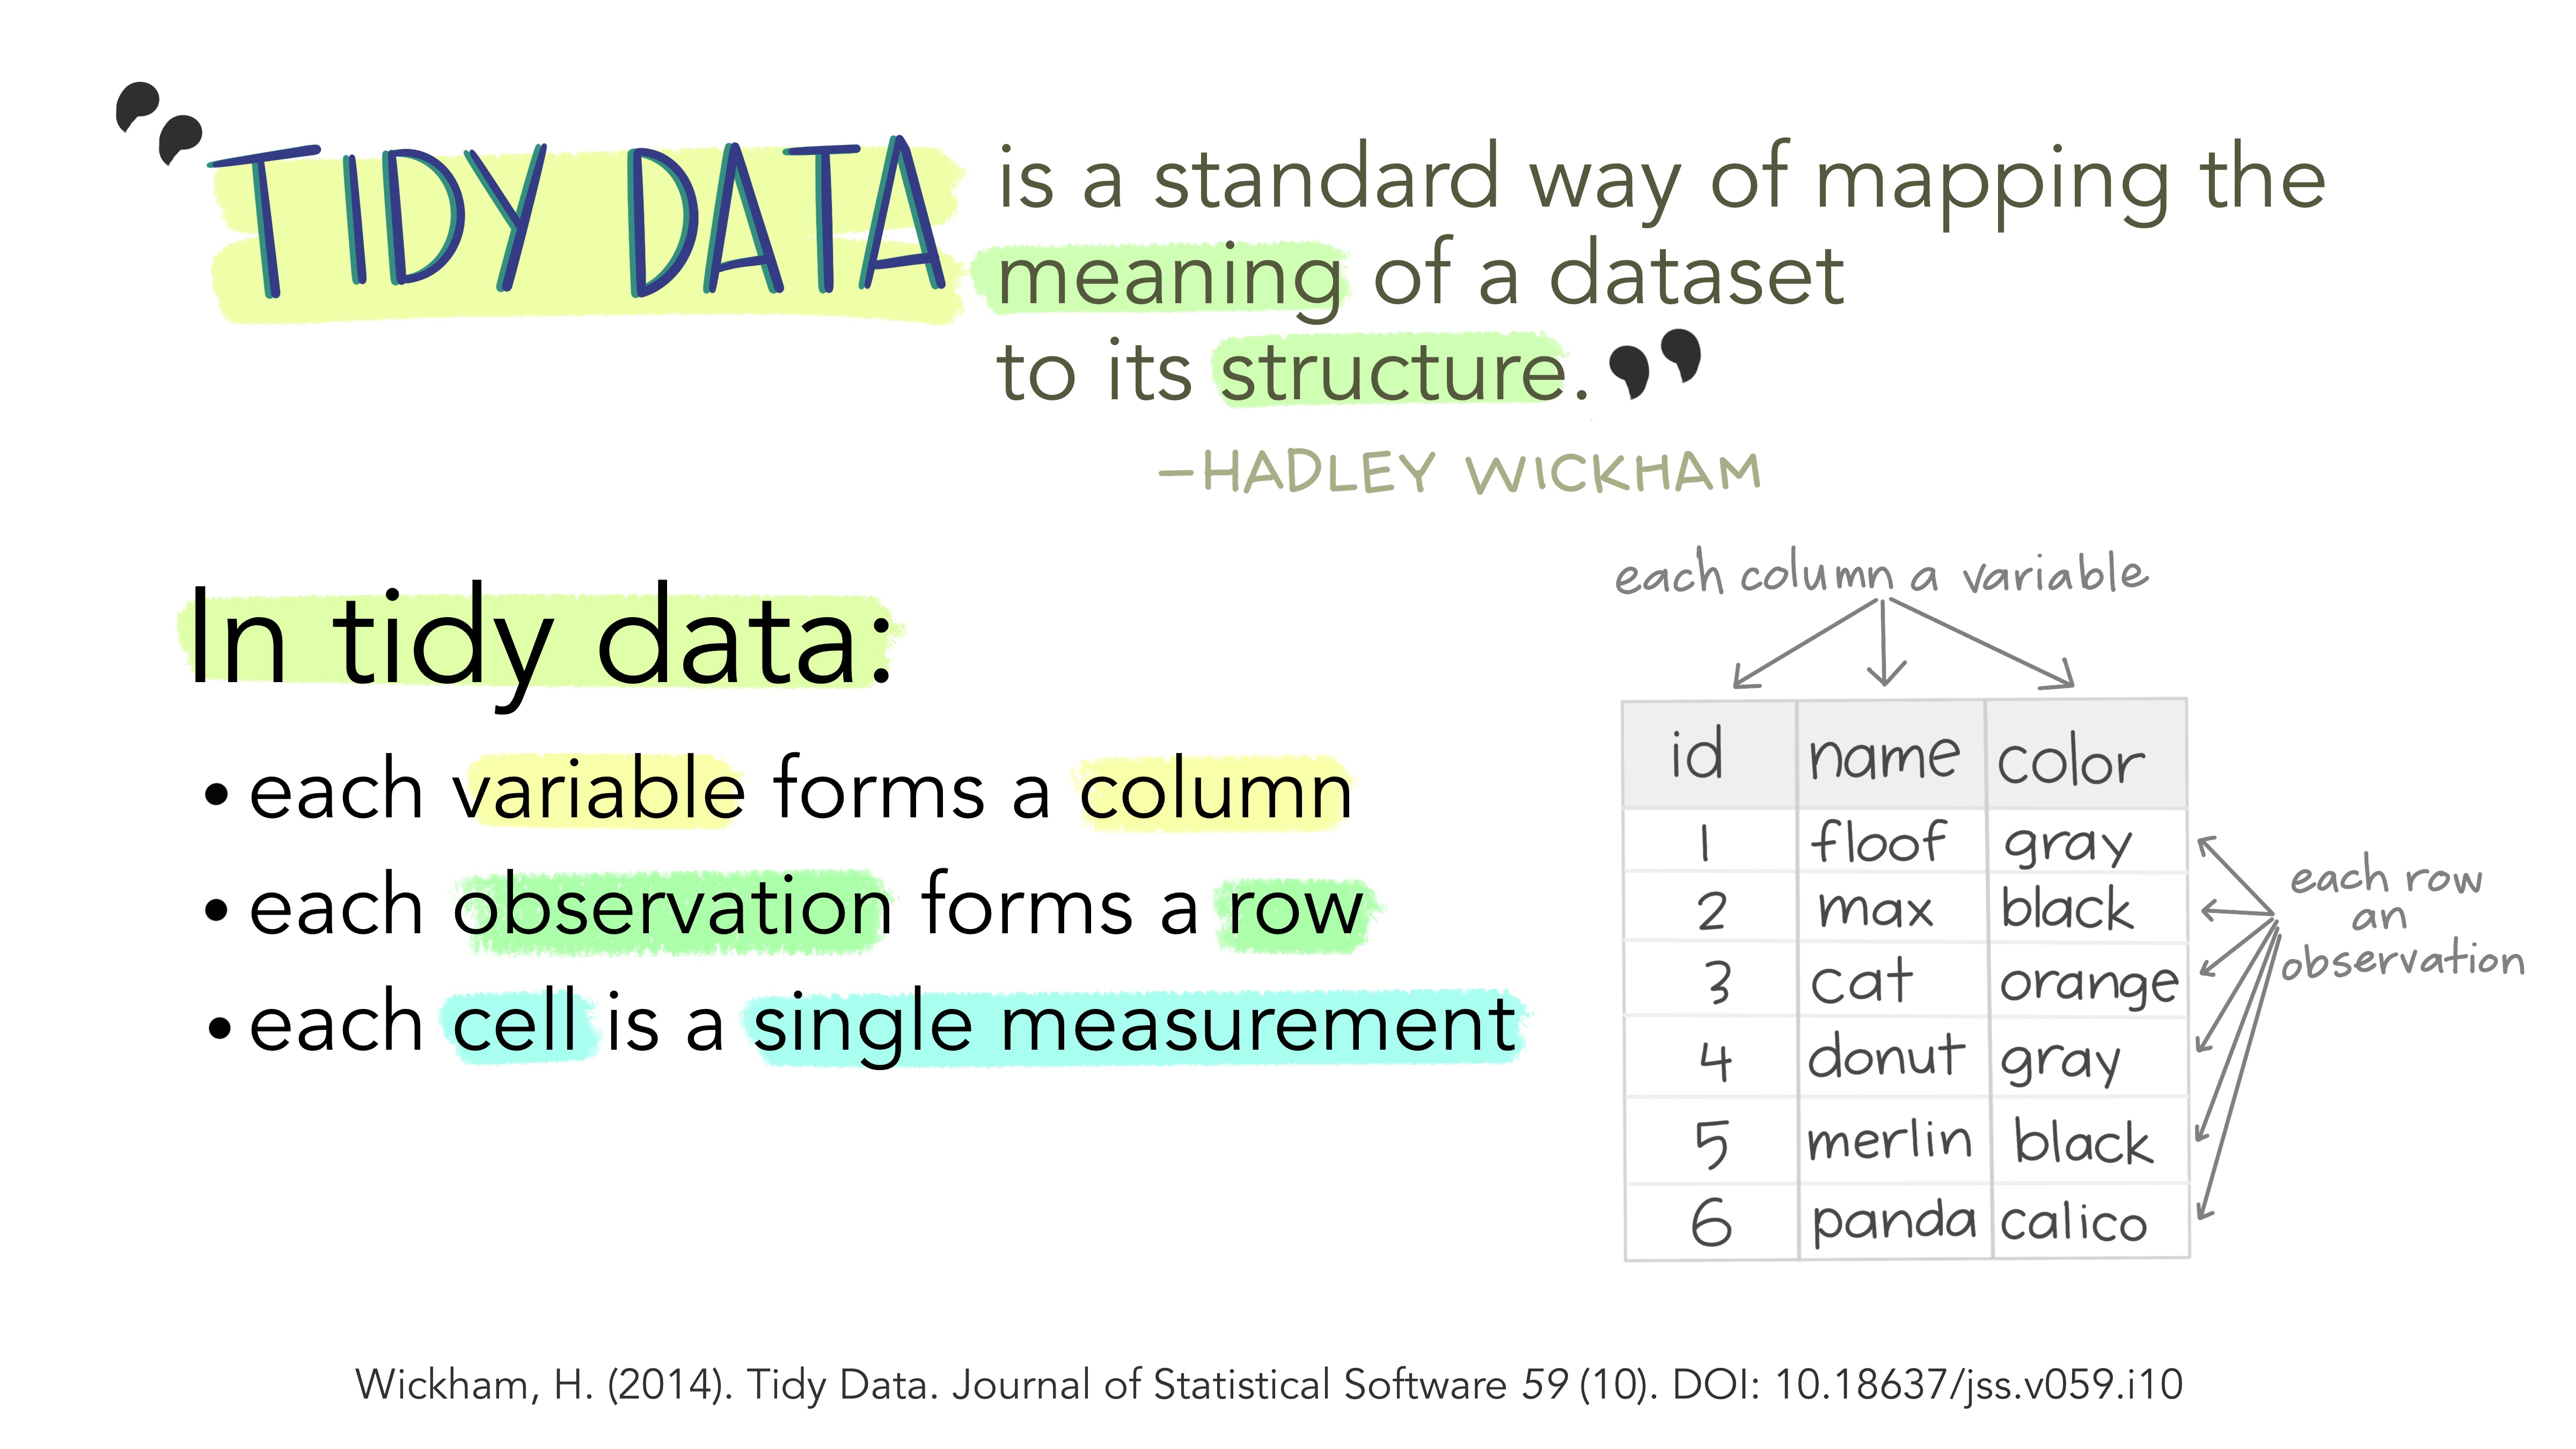
What is tidy data

https://r4ds.hadley.nz/data-tidy.html

What is tidy data

What is tidy data

What is tidy data

What is tidy data

Tidyverse guiding principles

  • It is human centered, i.e. the tidyverse is designed specifically to support the activities of a human data analyst.

  • It is consistent, so that what you learn about one function or package can be applied to another, and the number of special cases that you need to remember is as small as possible.

  • It is composable, allowing you to solve complex problems by breaking them down into small pieces, supporting a rapid cycle of exploratory iteration to find the best solution.

  • It is inclusive, because the tidyverse is not just the collection of packages, but it is also the community of people who use them.

https://design.tidyverse.org/unifying.html

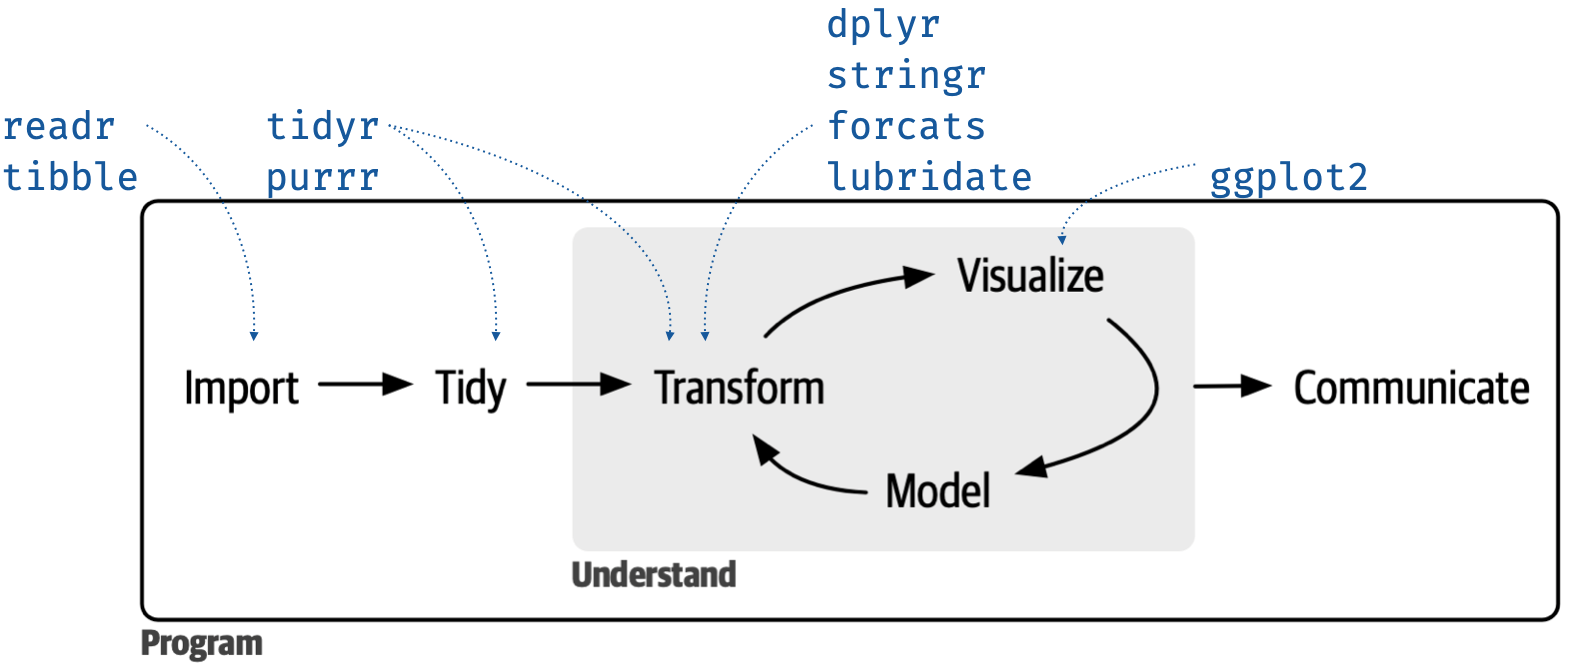
Data Science workflow

Data science workflow

  • Model has its own tidy universe, called tidymodels
  • Communicate is done with other tools (Markdown, Quarto)

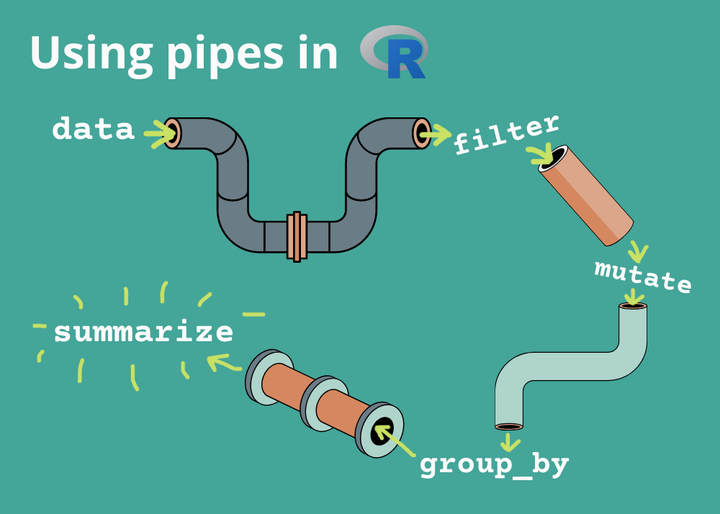
The pipe

Pipes in R

The pipe

#Example code:
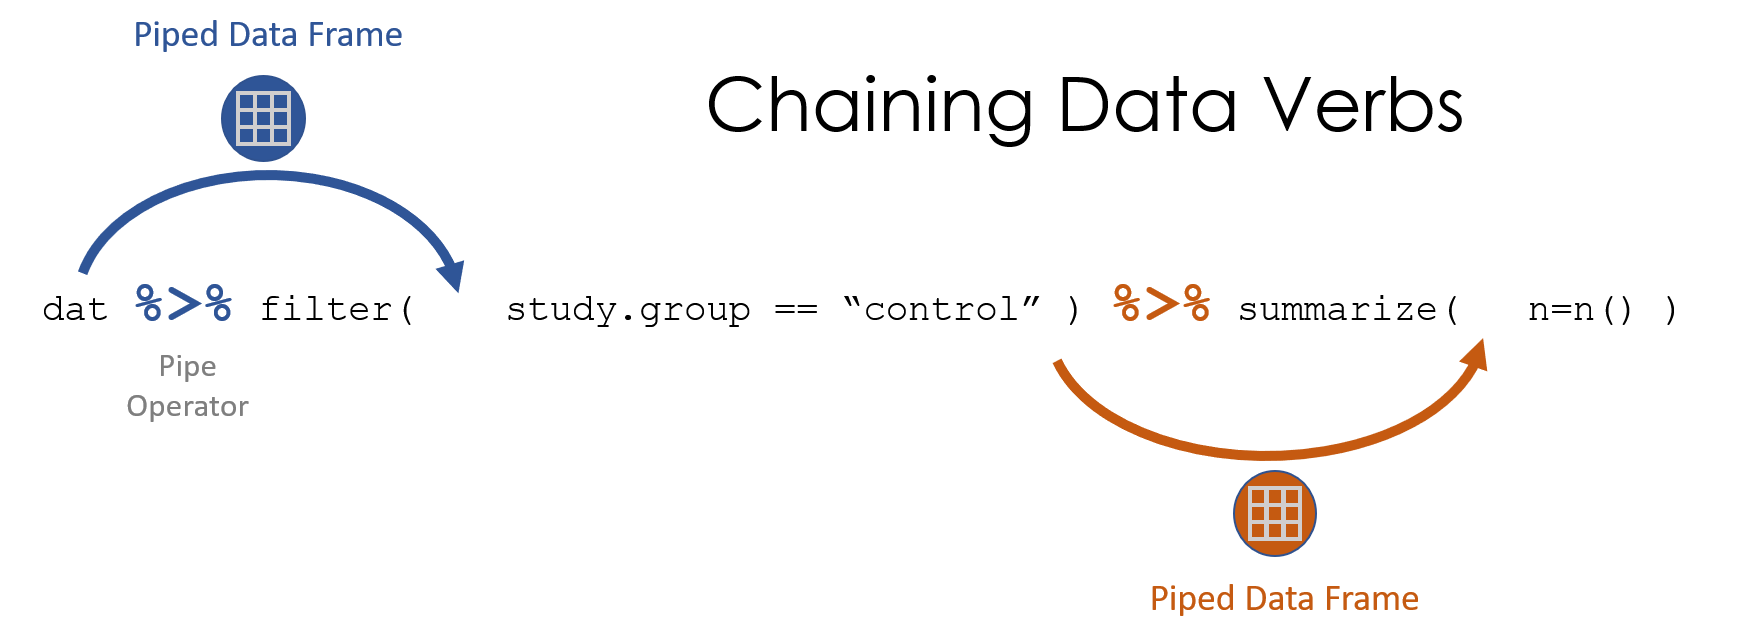
dat %>% 
  filter(study.group == "control")

#Equivalent to:
filter(dat, study.group == "control")

The pipe

#Example code:
dat %>% 
  filter(study.group == "control") %>% 
  summarize(n = n())

#Equivalent to:
summarize(filter(dat, study.group == "control"), n = n())

The pipe

#Example code:
dat %>% 
  filter(study.group == "control") %>% 
  mutate(new_column = "something") %>% 
  summarize(n = n())

#Equivalent to:
summarize(mutate(filter(dat, study.group == "control"),new_colum == "something"), n = n())

The pipe


  • Easy to skim because verbs come at the start of each line
  • To add the pipe to your code you can use Ctrl/Cmd + Shift + M
  • It is included in the core tidyverse
#Example code:
dat %>% 
  filter(study.group == "control") %>% 
  mutate(new_column = "something") %>% 
  summarize(n = n())

#Equivalent to:
summarize(mutate(filter(dat, study.group == "control"),new_colum == "something"), n = n())

The pipe

  • Inside a pipe, you can refer to the previous output as . (dot)

x %>% f(y) is the same as f(x, y)
y %>% f(x, ., z) is the same as f(x, y, z )

Data

transformation

dplyr to the rescue

dplyr hex sticker
  • First argument is always a data frame

  • Other arguments (usually) are the names of the columns to operate on, without the quotes

  • The output is always a new data frame

dplyr to the rescue


dplyr’s verbs can be organized into groups, based on what they operate on:

  → Rows (Change rows, w/o affecting columns)

  → Columns (Change columns, w/o affecting rows )

  → Groups

  → Tables

Rows

Prerequisites

library(tidyverse) #loads the tidyverse functions
library(gapminder) #loads the gapminder dataset

#tibble with 1704 rows and 6 columns
glimpse(gapminder)
Rows: 1,704
Columns: 6
$ country   <fct> "Afghanistan", "Afghanistan", "Afghanistan", "Afghanistan", …
$ continent <fct> Asia, Asia, Asia, Asia, Asia, Asia, Asia, Asia, Asia, Asia, …
$ year      <int> 1952, 1957, 1962, 1967, 1972, 1977, 1982, 1987, 1992, 1997, …
$ lifeExp   <dbl> 28.801, 30.332, 31.997, 34.020, 36.088, 38.438, 39.854, 40.8…
$ pop       <int> 8425333, 9240934, 10267083, 11537966, 13079460, 14880372, 12…
$ gdpPercap <dbl> 779.4453, 820.8530, 853.1007, 836.1971, 739.9811, 786.1134, …
Sneak peek of the tidyverse

  • Calculating the gap in lifeExp by continent
  • The base R way
#Calculating the gap in lifeExp by continent
africa <- gapminder[gapminder$continent == "Africa", ]
africa_mm <- max(africa$lifeExp) - min(africa$lifeExp)

americas <- gapminder[gapminder$continent == "Americas", ]
americas_mm <- max(americas$lifeExp) - min(americas$lifeExp)

asia <- gapminder[gapminder$continent == "Asia", ]
asia_mm <- max(asia$lifeExp) - min(africa$lifeExp)

europe <- gapminder[gapminder$continent == "Europe", ]
europe_mm <- max(europe$lifeExp) - min(europe$lifeExp)

oceania <- gapminder[gapminder$continent == "Oceania", ]
oceania_mm <- max(europe$lifeExp) - min(oceania$lifeExp)

cbind(
  continent = c("Africa", "Asias", "Europe", "Oceania"),
  max_minus_min = c(africa_mm, americas_mm, asia_mm, europe_mm, oceania_mm)
  )
  • Prone to errors and hard to understand and debug

Sneak peek of the tidyverse

     continent max_minus_min
[1,] "Africa"  "52.843"     
[2,] "Asias"   "43.074"     
[3,] "Europe"  "59.004"     
[4,] "Oceania" "38.172"     
[5,] "Africa"  "12.637"     

Sneak peek of the tidyverse

  • Calculating the gap in lifeExp by continent
  • The tidyverse way
gapminder %>% 
 group_by(continent) %>% 
 summarize(max_minus_min = max(lifeExp) - min(lifeExp))
# A tibble: 5 × 2
  continent max_minus_min
  <fct>             <dbl>
1 Africa             52.8
2 Americas           43.1
3 Asia               53.8
4 Europe             38.2
5 Oceania            12.1

Filter rows with filter()

Filter observations
  • filter() is used to subset observations based on their values
  • 1st argument is the name of the data frame
  • Other arguments are logical expressions that filter the data

Important

To check if A equals B we use the equality operator (==).
Not to be confused with the assignment operator (=).

Filter rows with filter()


#Portuguese data
gapminder %>% 
  filter(country == "Portugal")
# A tibble: 12 × 6
   country  continent  year lifeExp      pop gdpPercap
   <fct>    <fct>     <int>   <dbl>    <int>     <dbl>
 1 Portugal Europe     1952    59.8  8526050     3068.
 2 Portugal Europe     1957    61.5  8817650     3775.
 3 Portugal Europe     1962    64.4  9019800     4728.
 4 Portugal Europe     1967    66.6  9103000     6362.
 5 Portugal Europe     1972    69.3  8970450     9022.
 6 Portugal Europe     1977    70.4  9662600    10172.
 7 Portugal Europe     1982    72.8  9859650    11754.
 8 Portugal Europe     1987    74.1  9915289    13039.
 9 Portugal Europe     1992    74.9  9927680    16207.
10 Portugal Europe     1997    76.0 10156415    17641.
11 Portugal Europe     2002    77.3 10433867    19971.
12 Portugal Europe     2007    78.1 10642836    20510.

Filter rows with filter()


#Portuguese data
#Equivalent to the previous code
filter(gapminder, country == "Portugal")
# A tibble: 12 × 6
   country  continent  year lifeExp      pop gdpPercap
   <fct>    <fct>     <int>   <dbl>    <int>     <dbl>
 1 Portugal Europe     1952    59.8  8526050     3068.
 2 Portugal Europe     1957    61.5  8817650     3775.
 3 Portugal Europe     1962    64.4  9019800     4728.
 4 Portugal Europe     1967    66.6  9103000     6362.
 5 Portugal Europe     1972    69.3  8970450     9022.
 6 Portugal Europe     1977    70.4  9662600    10172.
 7 Portugal Europe     1982    72.8  9859650    11754.
 8 Portugal Europe     1987    74.1  9915289    13039.
 9 Portugal Europe     1992    74.9  9927680    16207.
10 Portugal Europe     1997    76.0 10156415    17641.
11 Portugal Europe     2002    77.3 10433867    19971.
12 Portugal Europe     2007    78.1 10642836    20510.

Filter rows with filter()


#Portuguese data for the year 2007
gapminder %>% 
  filter(country == "Portugal", 
         year == 2007) 
# A tibble: 1 × 6
  country  continent  year lifeExp      pop gdpPercap
  <fct>    <fct>     <int>   <dbl>    <int>     <dbl>
1 Portugal Europe     2007    78.1 10642836    20510.
#Alternatively, using the and (&) operator
gapminder %>% 
  filter(country == "Portugal" & year == 2007)
# A tibble: 1 × 6
  country  continent  year lifeExp      pop gdpPercap
  <fct>    <fct>     <int>   <dbl>    <int>     <dbl>
1 Portugal Europe     2007    78.1 10642836    20510.

Filter rows with filter()


#Portuguese or Spanish data for the year 2007
gapminder %>% 
  filter(country == "Portugal" | country == "Spain", 
         year == 2007) 
# A tibble: 2 × 6
  country  continent  year lifeExp      pop gdpPercap
  <fct>    <fct>     <int>   <dbl>    <int>     <dbl>
1 Portugal Europe     2007    78.1 10642836    20510.
2 Spain    Europe     2007    80.9 40448191    28821.
#Alternatively, using the %in% operator
gapminder %>% 
  filter(country %in% c("Portugal","Spain"), 
         year == 2007) 
# A tibble: 2 × 6
  country  continent  year lifeExp      pop gdpPercap
  <fct>    <fct>     <int>   <dbl>    <int>     <dbl>
1 Portugal Europe     2007    78.1 10642836    20510.
2 Spain    Europe     2007    80.9 40448191    28821.

Filter rows with filter()


Tip

The %in% operator is very useful inside filter(), because it is easy to test different inputs. It allows single or multiple user selection. Using the == oeprator we would need to change the code everytime.

countries <- "Portugal"

#No need to change the chart code! Just the input fields above
gapminder %>% 
  filter(country %in% countries) %>% 
  ggplot(aes(x = year,
             y = lifeExp, 
             color = country)) +
  geom_line()

countries <- c("Portugal","Spain")

#No need to change the chart code! Just the input fields above
gapminder %>% 
  filter(country %in% countries) %>% 
  ggplot(aes(x = year, 
             y = lifeExp, 
             color = country)) +
  geom_line()

Filter rows with filter()


  • Common mistakes
gapminder %>% 
  filter(year = 2007) 
Error in `filter()`:
! We detected a named input.
ℹ This usually means that you've used `=` instead of `==`.
ℹ Did you mean `year == 2007`?

Filter rows with filter()


  • Common mistakes
#Does not throw error, but does nothing
# what happens is that R checks the condition (year == 2002) 
# and then checks the condition 2007, which doesn't make sense
gapminder %>% 
  filter(year == 2002 | 2007) 
# A tibble: 1,704 × 6
   country     continent  year lifeExp      pop gdpPercap
   <fct>       <fct>     <int>   <dbl>    <int>     <dbl>
 1 Afghanistan Asia       1952    28.8  8425333      779.
 2 Afghanistan Asia       1957    30.3  9240934      821.
 3 Afghanistan Asia       1962    32.0 10267083      853.
 4 Afghanistan Asia       1967    34.0 11537966      836.
 5 Afghanistan Asia       1972    36.1 13079460      740.
 6 Afghanistan Asia       1977    38.4 14880372      786.
 7 Afghanistan Asia       1982    39.9 12881816      978.
 8 Afghanistan Asia       1987    40.8 13867957      852.
 9 Afghanistan Asia       1992    41.7 16317921      649.
10 Afghanistan Asia       1997    41.8 22227415      635.
# ℹ 1,694 more rows

Filter rows with filter()


Using the airquality dataset, filter only observations from
a) September,
b) for days that are multiples of five,
c) where temperature was above 80.
airquality %>% 
  filter(Month == 9,
         Day %in% seq(5,30,5),
         Temp > 80)
  Ozone Solar.R Wind Temp Month Day
1    47      95  7.4   87     9   5
2    16     201  8.0   82     9  20

Arrange rows with arrange()

  • arrange() changes the order of the rows based on the value of the columns (One or more)
  • The number of rows does not change
#Arrange/sort by year (oldest to newest - ascending)
gapminder %>% 
  arrange(year)
# A tibble: 1,704 × 6
   country     continent  year lifeExp      pop gdpPercap
   <fct>       <fct>     <int>   <dbl>    <int>     <dbl>
 1 Afghanistan Asia       1952    28.8  8425333      779.
 2 Albania     Europe     1952    55.2  1282697     1601.
 3 Algeria     Africa     1952    43.1  9279525     2449.
 4 Angola      Africa     1952    30.0  4232095     3521.
 5 Argentina   Americas   1952    62.5 17876956     5911.
 6 Australia   Oceania    1952    69.1  8691212    10040.
 7 Austria     Europe     1952    66.8  6927772     6137.
 8 Bahrain     Asia       1952    50.9   120447     9867.
 9 Bangladesh  Asia       1952    37.5 46886859      684.
10 Belgium     Europe     1952    68    8730405     8343.
# ℹ 1,694 more rows

Arrange rows with arrange()

  • desc() can be used inside arrange() to arrange descending
#Arrange/sort by year (newest to oldest - descending) 
gapminder %>% 
  arrange(desc(year))
# A tibble: 1,704 × 6
   country     continent  year lifeExp       pop gdpPercap
   <fct>       <fct>     <int>   <dbl>     <int>     <dbl>
 1 Afghanistan Asia       2007    43.8  31889923      975.
 2 Albania     Europe     2007    76.4   3600523     5937.
 3 Algeria     Africa     2007    72.3  33333216     6223.
 4 Angola      Africa     2007    42.7  12420476     4797.
 5 Argentina   Americas   2007    75.3  40301927    12779.
 6 Australia   Oceania    2007    81.2  20434176    34435.
 7 Austria     Europe     2007    79.8   8199783    36126.
 8 Bahrain     Asia       2007    75.6    708573    29796.
 9 Bangladesh  Asia       2007    64.1 150448339     1391.
10 Belgium     Europe     2007    79.4  10392226    33693.
# ℹ 1,694 more rows

Arrange rows with arrange()


#Arrange/sort by continent (descending) and then by lifeExp (ascending)
gapminder %>% 
  arrange(desc(continent), lifeExp)
# A tibble: 1,704 × 6
   country     continent  year lifeExp      pop gdpPercap
   <fct>       <fct>     <int>   <dbl>    <int>     <dbl>
 1 Australia   Oceania    1952    69.1  8691212    10040.
 2 New Zealand Oceania    1952    69.4  1994794    10557.
 3 New Zealand Oceania    1957    70.3  2229407    12247.
 4 Australia   Oceania    1957    70.3  9712569    10950.
 5 Australia   Oceania    1962    70.9 10794968    12217.
 6 Australia   Oceania    1967    71.1 11872264    14526.
 7 New Zealand Oceania    1962    71.2  2488550    13176.
 8 New Zealand Oceania    1967    71.5  2728150    14464.
 9 New Zealand Oceania    1972    71.9  2929100    16046.
10 Australia   Oceania    1972    71.9 13177000    16789.
# ℹ 1,694 more rows

Arrange rows with arrange()


Note

When arranging a column that has NA values, they ALWAYS appear at the end of the dataset, whether the arrange() is ascending or descending.
When arranging by multiple columns, NAs will appear at the end of each group.

Arrange rows with arrange()


Using the gapminder dataset, show a data frame with the most recent year only, ordered by life expectancy (higher to lower)
gapminder %>% 
  filter(year == 2007) %>% 
  arrange(desc(lifeExp))
# A tibble: 142 × 6
   country          continent  year lifeExp       pop gdpPercap
   <fct>            <fct>     <int>   <dbl>     <int>     <dbl>
 1 Japan            Asia       2007    82.6 127467972    31656.
 2 Hong Kong, China Asia       2007    82.2   6980412    39725.
 3 Iceland          Europe     2007    81.8    301931    36181.
 4 Switzerland      Europe     2007    81.7   7554661    37506.
 5 Australia        Oceania    2007    81.2  20434176    34435.
 6 Spain            Europe     2007    80.9  40448191    28821.
 7 Sweden           Europe     2007    80.9   9031088    33860.
 8 Israel           Asia       2007    80.7   6426679    25523.
 9 France           Europe     2007    80.7  61083916    30470.
10 Canada           Americas   2007    80.7  33390141    36319.
# ℹ 132 more rows

Unique values with distinct()


  • distinct() finds all the unique rows in a dataset.
  • Can be used for a single column or combination of columns.
#Get a list of unique/distinct years
gapminder %>% 
  distinct(country)
# A tibble: 142 × 1
   country    
   <fct>      
 1 Afghanistan
 2 Albania    
 3 Algeria    
 4 Angola     
 5 Argentina  
 6 Australia  
 7 Austria    
 8 Bahrain    
 9 Bangladesh 
10 Belgium    
# ℹ 132 more rows

Unique values with distinct()


#Get a distinct combination of continent + year
gapminder %>% 
  distinct(continent, year)
# A tibble: 60 × 2
   continent  year
   <fct>     <int>
 1 Asia       1952
 2 Asia       1957
 3 Asia       1962
 4 Asia       1967
 5 Asia       1972
 6 Asia       1977
 7 Asia       1982
 8 Asia       1987
 9 Asia       1992
10 Asia       1997
# ℹ 50 more rows

Unique values with distinct()


  • What if we want to keep the other columns?
gapminder %>% 
  distinct(continent, year, 
           .keep_all = T)
# A tibble: 60 × 6
   country     continent  year lifeExp      pop gdpPercap
   <fct>       <fct>     <int>   <dbl>    <int>     <dbl>
 1 Afghanistan Asia       1952    28.8  8425333      779.
 2 Afghanistan Asia       1957    30.3  9240934      821.
 3 Afghanistan Asia       1962    32.0 10267083      853.
 4 Afghanistan Asia       1967    34.0 11537966      836.
 5 Afghanistan Asia       1972    36.1 13079460      740.
 6 Afghanistan Asia       1977    38.4 14880372      786.
 7 Afghanistan Asia       1982    39.9 12881816      978.
 8 Afghanistan Asia       1987    40.8 13867957      852.
 9 Afghanistan Asia       1992    41.7 16317921      649.
10 Afghanistan Asia       1997    41.8 22227415      635.
# ℹ 50 more rows

Warning

Note that only one country remains for each continent!
The .keep_all argument only keeps the first row of values.
If you wanted to know how many countries were available for each continent/year combination, the count() function would work.

Count rows with count()

#How many observations exist for each combination of continent + year?
gapminder %>% 
  count(continent, year) 
# A tibble: 60 × 3
   continent  year     n
   <fct>     <int> <int>
 1 Africa     1952    52
 2 Africa     1957    52
 3 Africa     1962    52
 4 Africa     1967    52
 5 Africa     1972    52
 6 Africa     1977    52
 7 Africa     1982    52
 8 Africa     1987    52
 9 Africa     1992    52
10 Africa     1997    52
# ℹ 50 more rows

Columns

Select columns with select()


Select columns
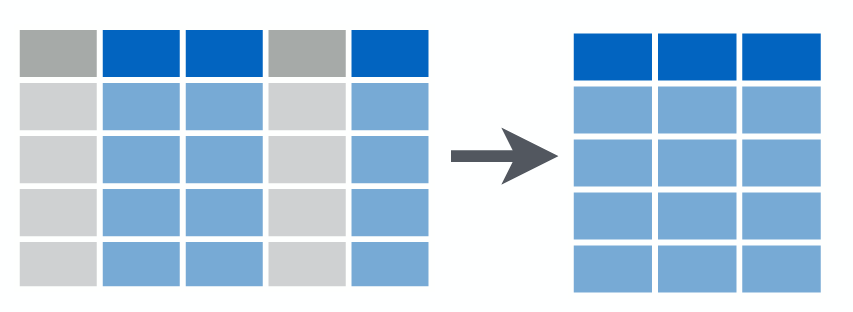
  • Select or exclude columns
#Select ONLY continent and lifeExp
gapminder %>% 
  select(continent, lifeExp) %>% 
  glimpse()
Rows: 1,704
Columns: 2
$ continent <fct> Asia, Asia, Asia, Asia, Asia, Asia, Asia, Asia, Asia, Asia, …
$ lifeExp   <dbl> 28.801, 30.332, 31.997, 34.020, 36.088, 38.438, 39.854, 40.8…

Select columns with select()


#Select columns BETWEEN continent and lifeExp (inclusive)
gapminder %>% 
  select(continent:lifeExp) %>% 
  glimpse()
Rows: 1,704
Columns: 3
$ continent <fct> Asia, Asia, Asia, Asia, Asia, Asia, Asia, Asia, Asia, Asia, …
$ year      <int> 1952, 1957, 1962, 1967, 1972, 1977, 1982, 1987, 1992, 1997, …
$ lifeExp   <dbl> 28.801, 30.332, 31.997, 34.020, 36.088, 38.438, 39.854, 40.8…

Select columns with select()


#Select columns EXCEPT those between continent and lifeExp (inclusive)
gapminder %>% 
  select(!continent:lifeExp) %>% 
  glimpse()
Rows: 1,704
Columns: 3
$ country   <fct> "Afghanistan", "Afghanistan", "Afghanistan", "Afghanistan", …
$ pop       <int> 8425333, 9240934, 10267083, 11537966, 13079460, 14880372, 12…
$ gdpPercap <dbl> 779.4453, 820.8530, 853.1007, 836.1971, 739.9811, 786.1134, …
Note

Previously - was used instead of !
When searching online for help you may still find answwers using -

Select columns with select()


  • The tidyverse has some helper functions that can be used with select(), from the tidyselect package.
  • One example is the where() function.
#Select only integer columns
gapminder %>% 
  select(where(is.integer)) %>% 
  glimpse()
Rows: 1,704
Columns: 2
$ year <int> 1952, 1957, 1962, 1967, 1972, 1977, 1982, 1987, 1992, 1997, 2002,…
$ pop  <int> 8425333, 9240934, 10267083, 11537966, 13079460, 14880372, 1288181…

Note

Note that is.integer is a function, and we are passing the function name as an argument of the where() function.

Select columns with select()


  • There are several selection helpers, which can be found in the tidyselect package vignette
#Select only columns of type double
gapminder %>% 
  select(where(is.double)) %>% 
  glimpse()
Rows: 1,704
Columns: 2
$ lifeExp   <dbl> 28.801, 30.332, 31.997, 34.020, 36.088, 38.438, 39.854, 40.8…
$ gdpPercap <dbl> 779.4453, 820.8530, 853.1007, 836.1971, 739.9811, 786.1134, …
#Select columns that start with the letter "c"
gapminder %>% 
  select(starts_with("c")) %>% 
  glimpse()
Rows: 1,704
Columns: 2
$ country   <fct> "Afghanistan", "Afghanistan", "Afghanistan", "Afghanistan", …
$ continent <fct> Asia, Asia, Asia, Asia, Asia, Asia, Asia, Asia, Asia, Asia, …

Select columns with select()


  • You can reorder and/or rename columns as you select them
#Select three columns, while renaming one
gapminder %>% 
  select(continent,
         le = lifeExp,
         year) %>% 
  glimpse()
Rows: 1,704
Columns: 3
$ continent <fct> Asia, Asia, Asia, Asia, Asia, Asia, Asia, Asia, Asia, Asia, …
$ le        <dbl> 28.801, 30.332, 31.997, 34.020, 36.088, 38.438, 39.854, 40.8…
$ year      <int> 1952, 1957, 1962, 1967, 1972, 1977, 1982, 1987, 1992, 1997, …

Rename columns with rename()


  • rename() keeps all existing variables and allows you to rename a few
  • The syntax is rename(.data, new_name = old_name)
#rename lifeExp to le
gapminder %>% 
  rename(le = lifeExp) %>% 
  glimpse()
Rows: 1,704
Columns: 6
$ country   <fct> "Afghanistan", "Afghanistan", "Afghanistan", "Afghanistan", …
$ continent <fct> Asia, Asia, Asia, Asia, Asia, Asia, Asia, Asia, Asia, Asia, …
$ year      <int> 1952, 1957, 1962, 1967, 1972, 1977, 1982, 1987, 1992, 1997, …
$ le        <dbl> 28.801, 30.332, 31.997, 34.020, 36.088, 38.438, 39.854, 40.8…
$ pop       <int> 8425333, 9240934, 10267083, 11537966, 13079460, 14880372, 12…
$ gdpPercap <dbl> 779.4453, 820.8530, 853.1007, 836.1971, 739.9811, 786.1134, …
Rename columns with janitor::clean_names()

  • For larger datasets with inconsistently named columns, the clean_names() function is a huge help
  • Suppose you have a gapminder dataset with inconsistent names
gapminder_crazy_names <- gapminder %>% 
  renameOUNTRY = country,
         Continent = continent,
         LifeExp = lifeExp,
         Ýear = year,
         PÔP = pop,
         GDPPercap = gdpPercap)

colnames(gapminder_crazy_names)
[1] "ÇOUNTRY"   "Continent" "Ýear"      "LifeExp"   "PÔP"       "GDPPercap"

Rename columns with janitor::clean_names()


  • Using clean_names()
#Suppose you have a gapminder dataset with inconsistent names
colnames(gapminder_crazy_names)
[1] "ÇOUNTRY"   "Continent" "Ýear"      "LifeExp"   "PÔP"       "GDPPercap"
library(janitor)
#rename lifeExp to le
gapminder_crazy_names %>% clean_names() %>% colnames()
[1] "country"    "continent"  "year"       "life_exp"   "pop"       
[6] "gdp_percap"

Note

The default output of clean_names() is lower case, with _ separating words.

Move columns with relocate()


  • relocate() moves variables around, without changing them
#make continent the first column
gapminder %>% 
  relocate(continent, .before = country) %>% #by var NAME 
  colnames()
[1] "continent" "country"   "year"      "lifeExp"   "pop"       "gdpPercap"
gapminder %>% 
  relocate(continent, .before = 1) %>% #by var INDEX 
  colnames()
[1] "continent" "country"   "year"      "lifeExp"   "pop"       "gdpPercap"

Move columns with relocate()


Note

The tidyselect helpers we saw earlier can be used anywhere that we need to “select” a column.

#Move all columns that end with "p" to the right of country
gapminder %>% 
  relocate(ends_with("p"), .after = country) %>% #by var NAME 
  colnames()
[1] "country"   "lifeExp"   "pop"       "gdpPercap" "continent" "year"     

Calculate variables with mutate()


mutate()
  • mutate() is used to add new columns, calculated from existing columns
  • By default columns are added to the right hand side of the dataset.
gapminder %>% 
  mutate(pop_millions = pop / 1e6,
         total_gdp = gdpPercap * pop) %>%
  head(5)
# A tibble: 5 × 8
  country     continent  year lifeExp      pop gdpPercap pop_millions  total_gdp
  <fct>       <fct>     <int>   <dbl>    <int>     <dbl>        <dbl>      <dbl>
1 Afghanistan Asia       1952    28.8  8425333      779.         8.43     6.57e9
2 Afghanistan Asia       1957    30.3  9240934      821.         9.24     7.59e9
3 Afghanistan Asia       1962    32.0 10267083      853.        10.3      8.76e9
4 Afghanistan Asia       1967    34.0 11537966      836.        11.5      9.65e9
5 Afghanistan Asia       1972    36.1 13079460      740.        13.1      9.68e9

Calculate variables with mutate()


mutate() is one of the most frequently used functions in a data analysis pipeline
  • Mutate in itself is trivial, the hard part is often the logic/calculations that go into creating the desired columns

Groups

Grouped subsets with group_by()


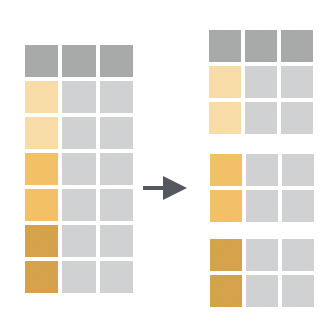
  • group_by() divides a dataset into meaningful groups
  • Doesn’t change the underlying data
  • Subsequent operations will be performed by each group

Grouped subsets with group_by()


  • looking closely at the output you see “# Groups: continent [5]”
#Group data by continent
gapminder %>% 
  group_by(continent)
# A tibble: 1,704 × 6
# Groups:   continent [5]
   country     continent  year lifeExp      pop gdpPercap
   <fct>       <fct>     <int>   <dbl>    <int>     <dbl>
 1 Afghanistan Asia       1952    28.8  8425333      779.
 2 Afghanistan Asia       1957    30.3  9240934      821.
 3 Afghanistan Asia       1962    32.0 10267083      853.
 4 Afghanistan Asia       1967    34.0 11537966      836.
 5 Afghanistan Asia       1972    36.1 13079460      740.
 6 Afghanistan Asia       1977    38.4 14880372      786.
 7 Afghanistan Asia       1982    39.9 12881816      978.
 8 Afghanistan Asia       1987    40.8 13867957      852.
 9 Afghanistan Asia       1992    41.7 16317921      649.
10 Afghanistan Asia       1997    41.8 22227415      635.
# ℹ 1,694 more rows

Grouped subsets with group_by()


  • It’s possible to group by more than one variable simultaneously
#Group data by continent and year
gapminder %>% 
  group_by(continent, year)
# A tibble: 1,704 × 6
# Groups:   continent, year [60]
   country     continent  year lifeExp      pop gdpPercap
   <fct>       <fct>     <int>   <dbl>    <int>     <dbl>
 1 Afghanistan Asia       1952    28.8  8425333      779.
 2 Afghanistan Asia       1957    30.3  9240934      821.
 3 Afghanistan Asia       1962    32.0 10267083      853.
 4 Afghanistan Asia       1967    34.0 11537966      836.
 5 Afghanistan Asia       1972    36.1 13079460      740.
 6 Afghanistan Asia       1977    38.4 14880372      786.
 7 Afghanistan Asia       1982    39.9 12881816      978.
 8 Afghanistan Asia       1987    40.8 13867957      852.
 9 Afghanistan Asia       1992    41.7 16317921      649.
10 Afghanistan Asia       1997    41.8 22227415      635.
# ℹ 1,694 more rows

Grouped summaries with summarise()


summarise()
  • summarise()1 is the most important grouped operation
  • Reduces the data frame to a single row, or one row for each group, if used with group_by()
#mean gdpPercap, worldwide
gapminder %>% 
  summarise(mean_gdp = mean(gdpPercap))
# A tibble: 1 × 1
  mean_gdp
     <dbl>
1    7215.
#mean gdpPercap, by continent
gapminder %>% 
  group_by(continent) %>% 
  summarise(mean_gdp = mean(gdpPercap))
# A tibble: 5 × 2
  continent mean_gdp
  <fct>        <dbl>
1 Africa       2194.
2 Americas     7136.
3 Asia         7902.
4 Europe      14469.
5 Oceania     18622.

Grouped summaries with summarise()


  • Multiple statistics/measures can be calculated inside summarise()
#mean gdpPercap, worldwide
gapminder %>% 
  summarise(n = n(),
            mean_gdp = mean(gdpPercap),
            median_pop = median(pop))
# A tibble: 1 × 3
      n mean_gdp median_pop
  <int>    <dbl>      <dbl>
1  1704    7215.   7023596.
#mean gdpPercap, by continent
gapminder %>% 
  group_by(continent) %>% 
  summarise(n = n(), #counts the number of rows
            mean_gdp = mean(gdpPercap),
            median_pop = median(pop))
# A tibble: 5 × 4
  continent     n mean_gdp median_pop
  <fct>     <int>    <dbl>      <dbl>
1 Africa      624    2194.   4579311 
2 Americas    300    7136.   6227510 
3 Asia        396    7902.  14530830.
4 Europe      360   14469.   8551125 
5 Oceania      24   18622.   6403492.

Grouped summaries with summarise()


Tip

The group_by() and summarise() combination is frequently seen at the end of a pipeline.
A typical workflow would be:
Import data → select and rename relevant columns → clean and process the dataset → filter desired rows → compute new columns → group and summarise

Important

When summarising a grouped data frame, the groups get dropped after the summarise() function call. However, other operations KEEP the groups by default.

Ungrouping grouped data frames


Important

When summarising a grouped data frame, the groups get dropped automatically after the summarise() function call. However, other operations KEEP the groups by default. To explicitly ungroup you can use the ungroup() function

#Create an ID column
gapminder %>% 
  group_by(continent) %>% 
  mutate(id = row_number())
# A tibble: 1,704 × 7
# Groups:   continent [5]
   country     continent  year lifeExp      pop gdpPercap    id
   <fct>       <fct>     <int>   <dbl>    <int>     <dbl> <int>
 1 Afghanistan Asia       1952    28.8  8425333      779.     1
 2 Afghanistan Asia       1957    30.3  9240934      821.     2
 3 Afghanistan Asia       1962    32.0 10267083      853.     3
 4 Afghanistan Asia       1967    34.0 11537966      836.     4
 5 Afghanistan Asia       1972    36.1 13079460      740.     5
 6 Afghanistan Asia       1977    38.4 14880372      786.     6
 7 Afghanistan Asia       1982    39.9 12881816      978.     7
 8 Afghanistan Asia       1987    40.8 13867957      852.     8
 9 Afghanistan Asia       1992    41.7 16317921      649.     9
10 Afghanistan Asia       1997    41.8 22227415      635.    10
# ℹ 1,694 more rows

Ungrouping grouped data frames


Important

When summarising a grouped data frame, the groups get dropped automatically after the summarise() function call. However, other operations KEEP the groups by default. To explicitly ungroup you can use the ungroup() function

#Create an ID column
gapminder %>% 
  group_by(continent) %>% 
  mutate(id = row_number()) %>% 
  summarise(mean = mean(lifeExp))
# A tibble: 5 × 2
  continent  mean
  <fct>     <dbl>
1 Africa     48.9
2 Americas   64.7
3 Asia       60.1
4 Europe     71.9
5 Oceania    74.3
  • Note that the data frame is still grouped after the mutate() call, because the output of summarise() is given by continent.

Tables

Join datasets with *_join()


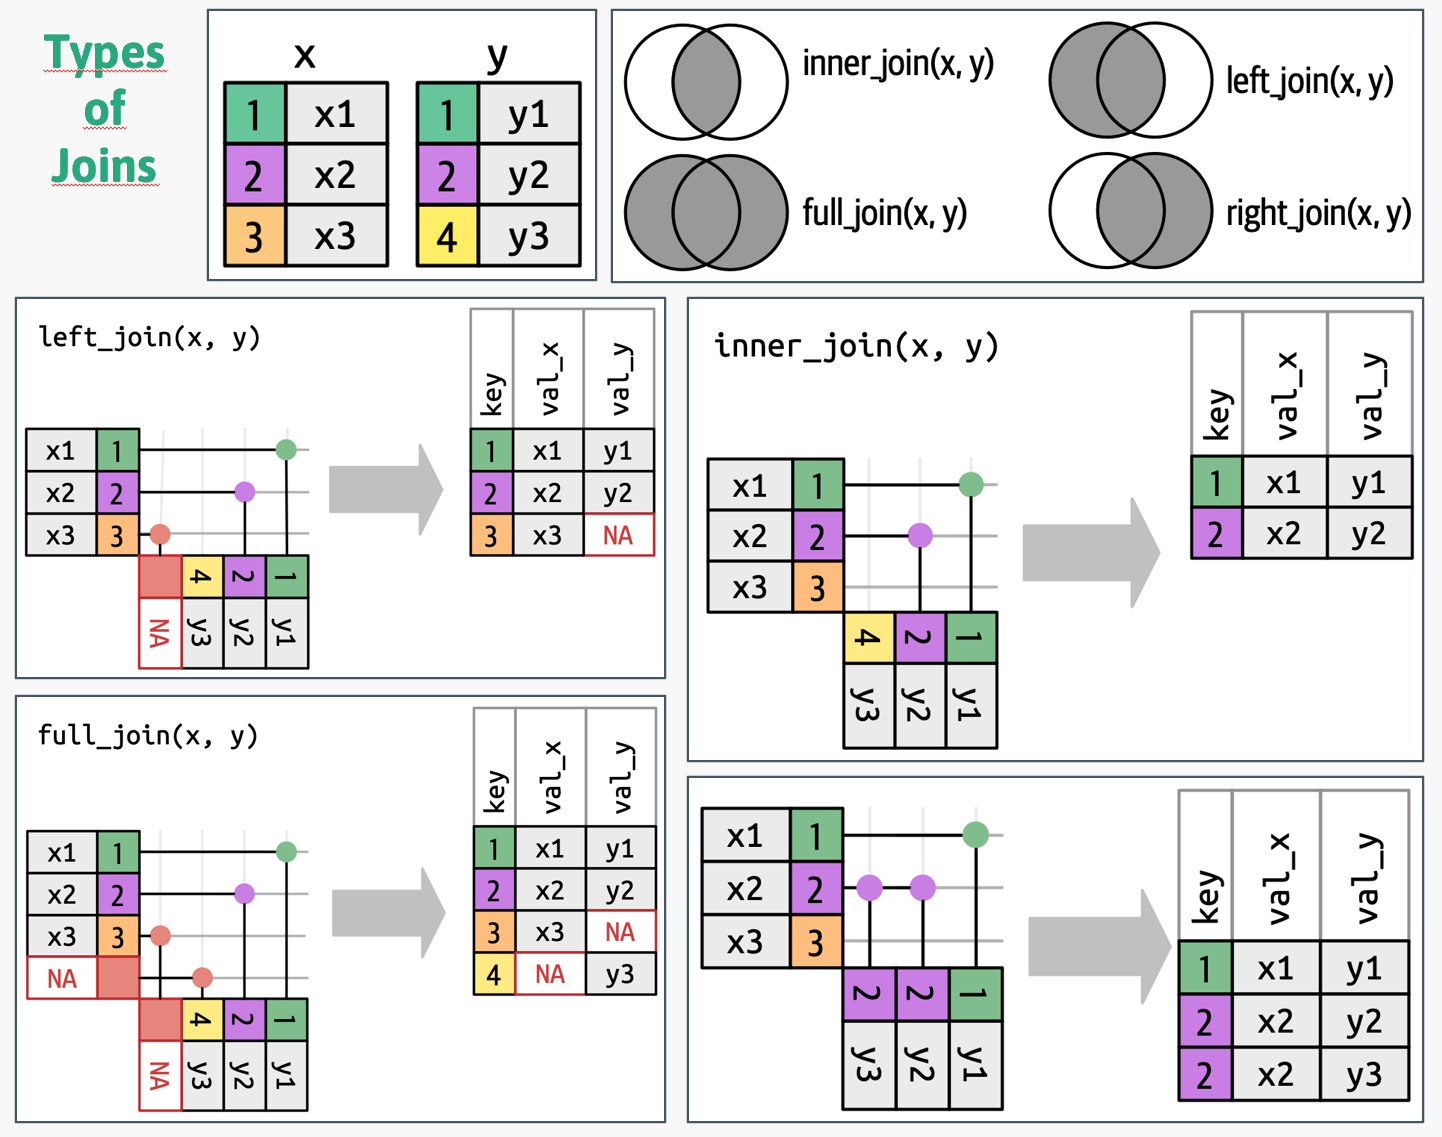
  • Data analysis frequently involves multiple datasets.
  • Datasets must be joined somehow - some column or set of columns that are equal in both datasets
  • This common identifier is called a key

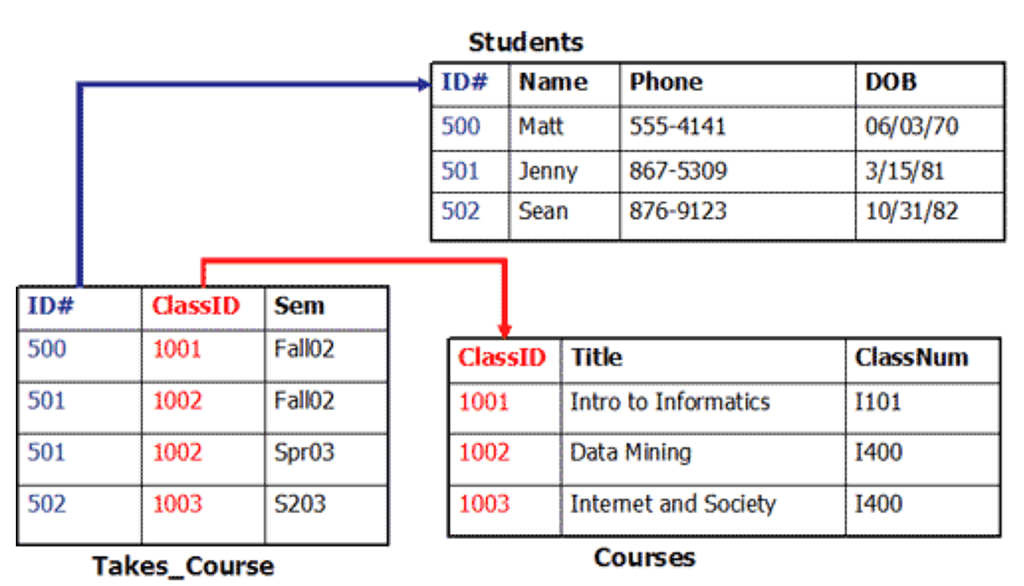
There are two types of keys: a Primary key (PK) and a Foreign key (FK)

A Primary Key is a variable or set of variables that uniquely identifies each observation.
A Foreign Key is a variable or set of variables that correspond to a Primary Key in another table

Join datasets with *_join()


  • ID# is a PK in the Students table, and a FK in the Takes_Course table.
  • ClassID is a PK in the Courses table, and a FK in the Takes_Course table.
  • The combination of ID# and ClassID is a PK in the Takes_Course table.

Important

Foreign Keys can be repeated, while Primary Keys must be unique!
Note that R does not enforce by default this restriction. That burden falls to the user.

Join datasets with *_join()

Join datasets with *_join()


  • Consider the following datasets:
#1) PT population in 2022 
pt_population %>% glimpse
Rows: 86
Columns: 3
$ year       <int> 2022, 2022, 2022, 2022, 2022, 2022, 2022, 2022, 2022, 2022,…
$ age        <chr> "75 anos", "83 anos", "3 anos", "2 anos", "6 anos", "16 ano…
$ population <int> 106539, 69073, 88015, 85532, 89039, 102837, 109057, 121978,…
#2) PT deaths in 2022
pt_deaths %>% glimpse
Rows: 119
Columns: 3
$ year   <int> 2022, 2022, 2022, 2022, 2022, 2022, 2022, 2022, 2022, 2022, 202…
$ age    <chr> "7 anos", "10 anos", "11 anos", "13 anos", "20 anos", "23 anos"…
$ deaths <int> 4, 4, 9, 12, 47, 44, 215, 433, 555, 3649, 4694, 132, 15, 34, 77…

Join datasets with *_join()


What column or columns do you consider the Primary Key in each table? How could we join them?

Join datasets with *_join()


  • left_join() allows you to combine two datasets
  • The output will have the same rows as x, the dataframe to which you are joining “external” data
  • If a value of x is not found on y, an NA is introduced

Join datasets with *_join()


  • In this case the column “year” is non-informative, because it has always the same value, therefore we only need to join by age
#Join deaths data to the population dataset, by age
pt_population %>% 
  left_join(x = .,
            y = pt_deaths,
            by = c("age")) %>% 
  head(5)
  year.x     age population year.y deaths
1   2022 75 anos     106539   2022   2498
2   2022 83 anos      69073   2022   4500
3   2022  3 anos      88015   2022     22
4   2022  2 anos      85532   2022     15
5   2022  6 anos      89039   2022     14

Note

Since both datasets had a column named year, that was not part of “by” condition, the output of left_join() adds a “.x” and “.y” suffix to each of the columns so that we know their origin. In this case they always have the same values, but that might not be the case in other situations.

Join datasets with *_join()


  • Generally, it would be recommended to join by age and year simultaneously.
#Join deaths data to the population dataset, by age and year
pt_population %>% 
  left_join(x = .,
            y = pt_deaths,
            by = c("age","year")) %>% 
  head(5)
  year     age population deaths
1 2022 75 anos     106539   2498
2 2022 83 anos      69073   4500
3 2022  3 anos      88015     22
4 2022  2 anos      85532     15
5 2022  6 anos      89039     14

Note

In this scenario the “year” variable is part of the “by” condition, therefore only a single “year” column exists in the output and no “.x” and “.y” columns are created.

Join datasets with *_join()


  • What if the columns to join by didn’t have the same name in both datasets?
#Rename the year variable to showcase this scenario
pt_deaths <- pt_deaths %>% 
  rename(YEAR = year)

colnames(pt_deaths)
[1] "YEAR"   "age"    "deaths"

Join datasets with *_join()


  • What if the columns to join by didn’t have the same name in both datasets?
#Join deaths data to the population dataset, by age and year
#year and YEAR have different names in each dataset
pt_population %>% 
  left_join(x = .,
            y = pt_deaths,
            by = c("age","year" = "YEAR")) %>% 
  head(5)
  year     age population deaths
1 2022 75 anos     106539   2498
2 2022 83 anos      69073   4500
3 2022  3 anos      88015     22
4 2022  2 anos      85532     15
5 2022  6 anos      89039     14

Important

When variable names differ you need to specify “var_in_x” = “var_in_y” for the variables with different names.

Join datasets with *_join()


  • Using the last example, check if any NAs were introduced
#assign the last calculation to a variable
pt_full_data <- pt_population %>% 
  left_join(x = .,
            y = pt_deaths,
            by = c("age","year" = "YEAR"))

#Show rows that have NA in any cell
pt_full_data %>% 
  filter(if_any(everything(),is.na))
  year            age population deaths
1 2022 85 e mais anos     368400     NA
2 2022          0 ano      83727     NA
Why were those NA introduced? Could NA be introduced in any other column during the left_join()?

Getting help

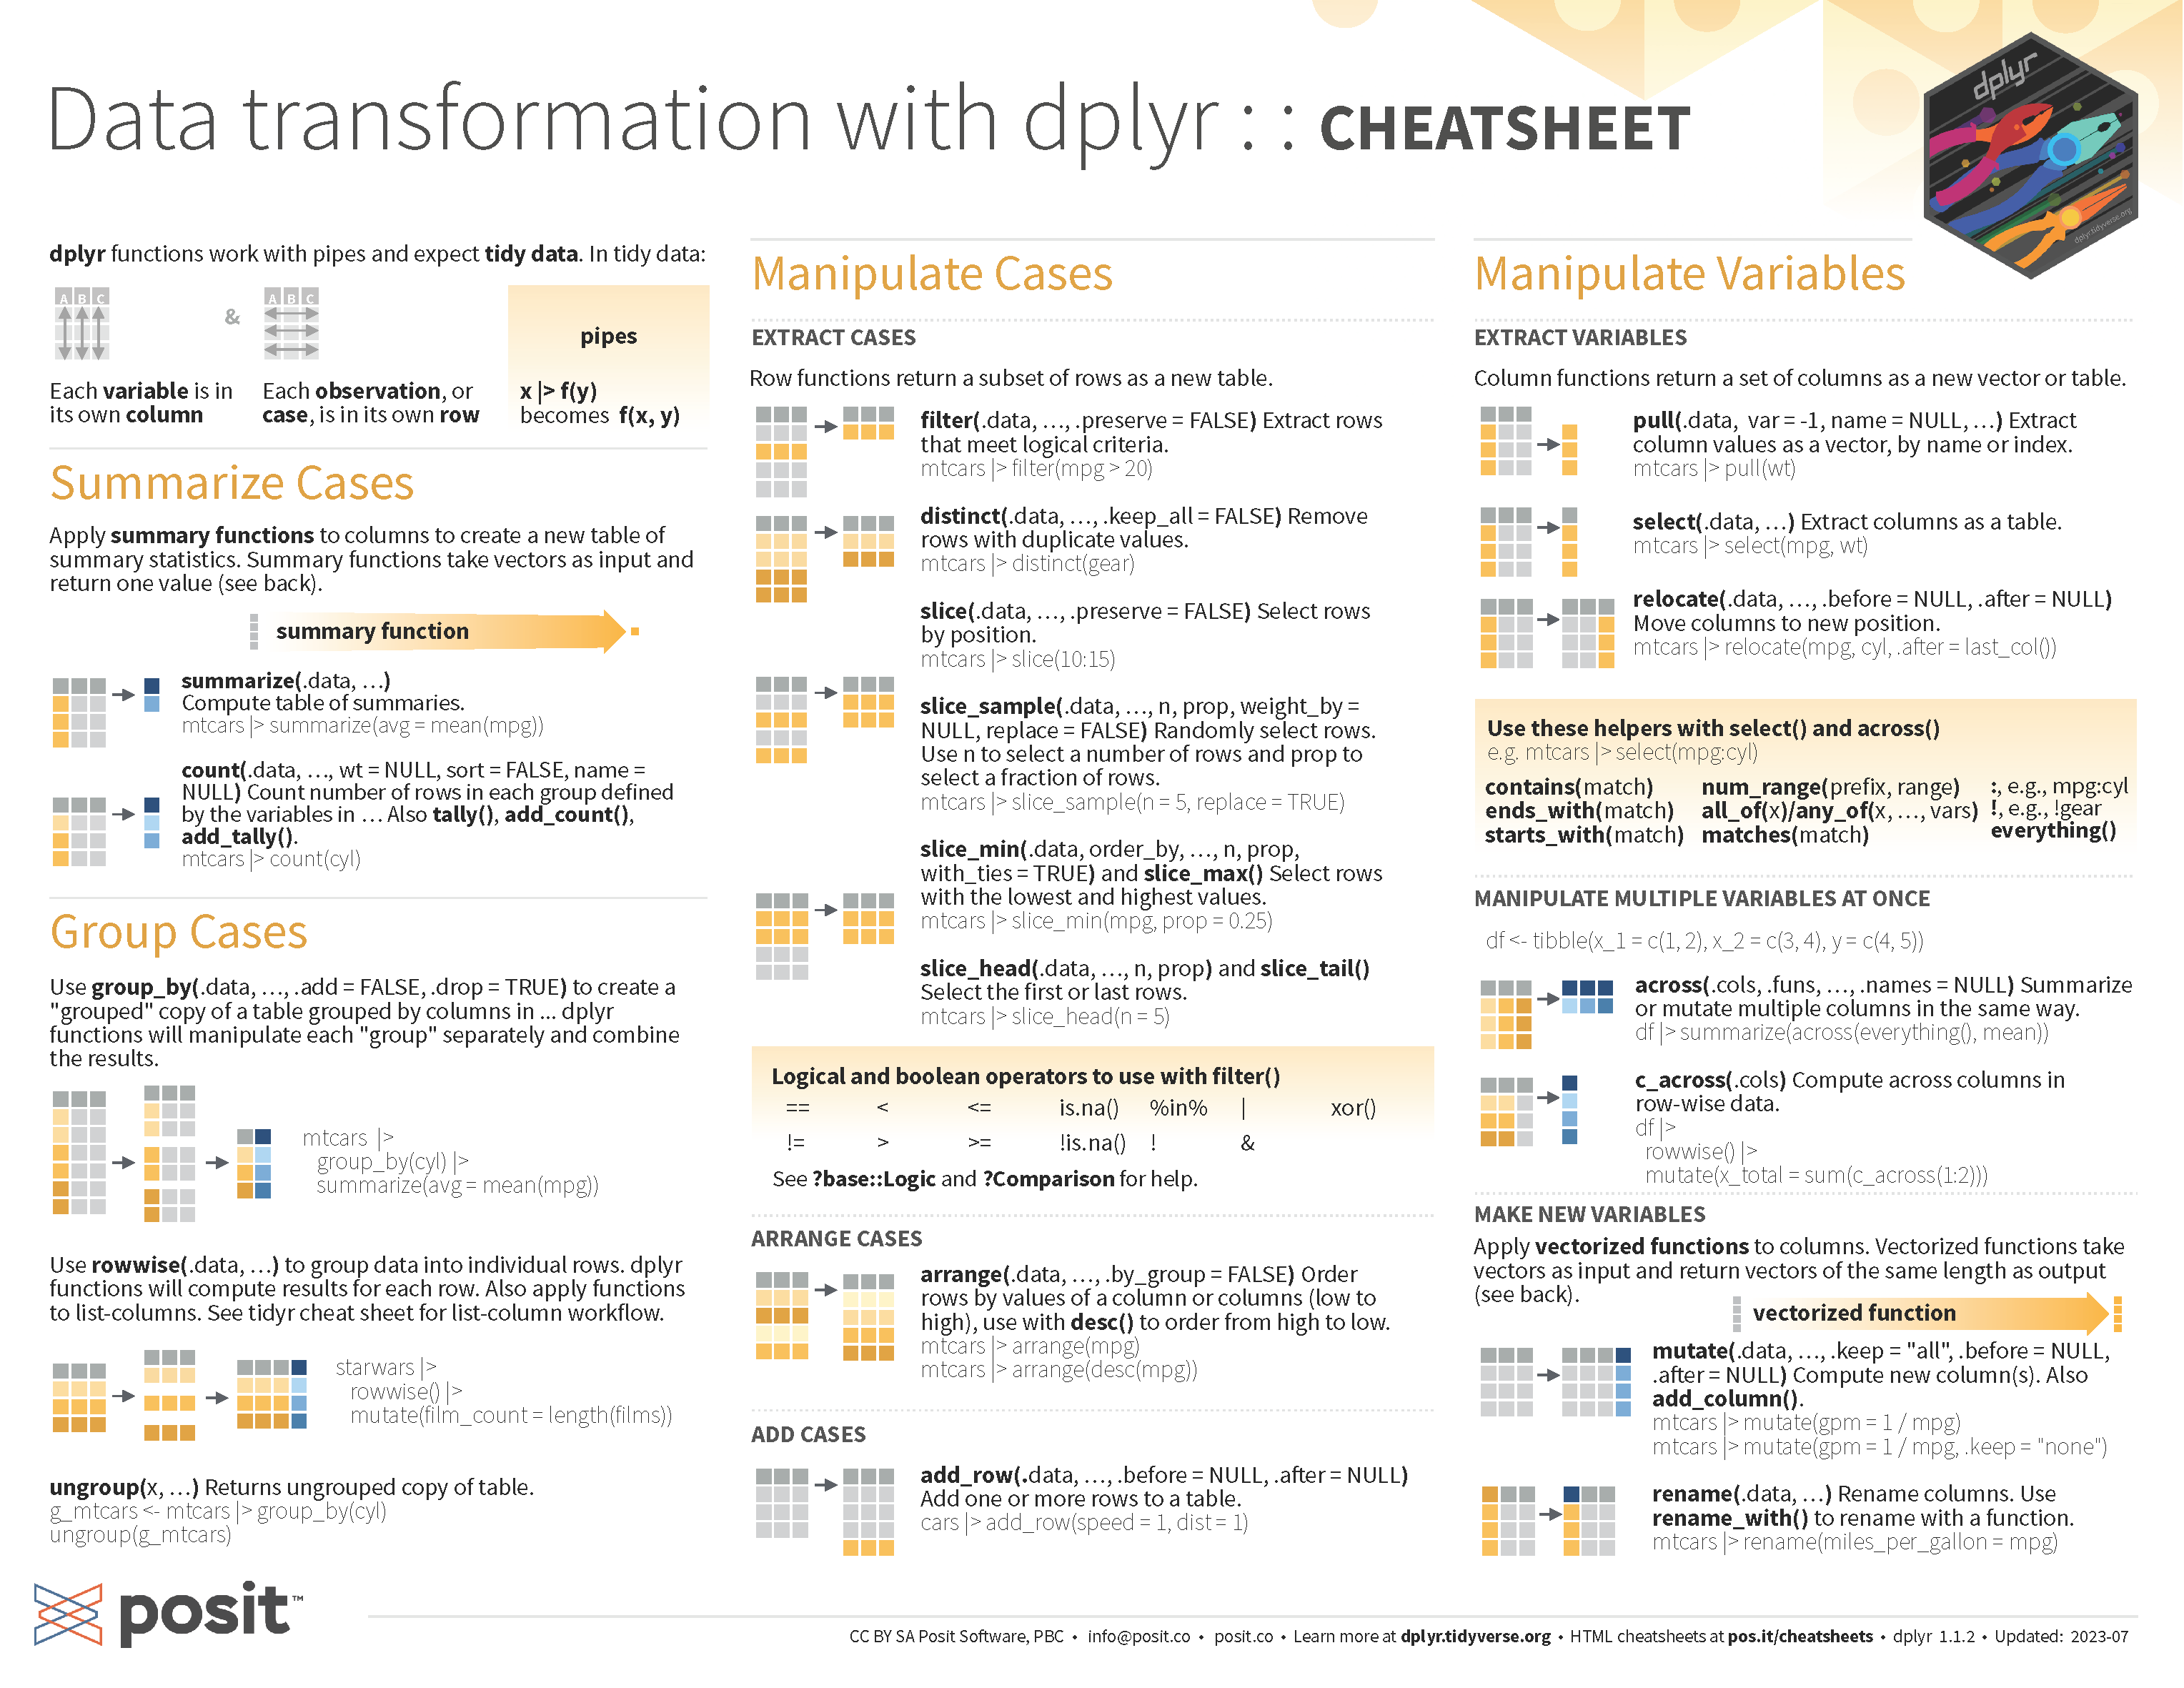
Posit cheatsheets

dplyr cheatsheet

Tidying data with tidyr


  • There are multiple ways to represent the same data
table1 %>% head(8)
# A tibble: 8 × 4
   year   age variable   value
  <int> <dbl> <chr>      <int>
1  2022     1 population 79975
2  2022     1 deaths        15
3  2022     2 population 85532
4  2022     2 deaths        15
5  2022     3 population 88015
6  2022     3 deaths        22
7  2022     4 population 88463
8  2022     4 deaths         9
Is this dataset tidy? Why?

Tidying data with tidyr


  • There are multiple ways to represent the same data
table2 %>% head(8)
# A tibble: 8 × 3
   year   age death_rate
  <int> <dbl> <chr>     
1  2022     1 15/79975  
2  2022     2 15/85532  
3  2022     3 22/88015  
4  2022     4 9/88463   
5  2022     5 6/87918   
6  2022     6 14/89039  
7  2022     7 4/87372   
8  2022     8 10/84277  
Is this dataset tidy? Why?

Tidying data with tidyr


  • There are multiple ways to represent the same data
table3 %>% head(8)
# A tibble: 8 × 4
   year   age population deaths
  <int> <dbl>      <int>  <int>
1  2022     1      79975     15
2  2022     2      85532     15
3  2022     3      88015     22
4  2022     4      88463      9
5  2022     5      87918      6
6  2022     6      89039     14
7  2022     7      87372      4
8  2022     8      84277     10
Is this dataset tidy? Why?

Tidying data with tidyr


  • Most built-in R functions work with vectors.
  • Tidy data allows R’s vectorized nature to shine.
table3 %>% 
  mutate(death_rate = 
           deaths / population * 1e5)
# A tibble: 84 × 5
    year   age population deaths death_rate
   <int> <dbl>      <int>  <int>      <dbl>
 1  2022     1      79975     15      18.8 
 2  2022     2      85532     15      17.5 
 3  2022     3      88015     22      25.0 
 4  2022     4      88463      9      10.2 
 5  2022     5      87918      6       6.82
 6  2022     6      89039     14      15.7 
 7  2022     7      87372      4       4.58
 8  2022     8      84277     10      11.9 
 9  2022     9      84561      3       3.55
10  2022    10      91241      4       4.38
# ℹ 74 more rows

Tidying data with tidyr


How would you calculate the death rate in table1 and table2?
  • Real world data is often untidy.
    • Data is organized to facilitate some goal other than analysis (e.g. entry, display in wide screens)
  • Most data science projects will require some level of tidying prior to analysis.

Lengthening data with pivot_longer()


  • The following dataset shows the plasma concentrations of Indomethacin over 11 periods of time, for 6 subjects.
  • This way of presenting data (Wide format) is frequently seen in repeated measures studies or time series data.
indometh_wide
# A tibble: 6 × 12
  Subject t0.25  t0.5 t0.75    t1 t1.25    t2    t3    t4    t5    t6    t8
  <ord>   <dbl> <dbl> <dbl> <dbl> <dbl> <dbl> <dbl> <dbl> <dbl> <dbl> <dbl>
1 1        1.5   0.94  0.78  0.48  0.37  0.19  0.12  0.11  0.08  0.07  0.05
2 2        2.03  1.63  0.71  0.7   0.64  0.36  0.32  0.2   0.25  0.12  0.08
3 3        2.72  1.49  1.16  0.8   0.8   0.39  0.22  0.12  0.11  0.08  0.08
4 4        1.85  1.39  1.02  0.89  0.59  0.4   0.16  0.11  0.1   0.07  0.07
5 5        2.05  1.04  0.81  0.39  0.3   0.23  0.13  0.11  0.08  0.1   0.06
6 6        2.31  1.44  1.03  0.84  0.64  0.42  0.24  0.17  0.13  0.1   0.09

Lengthening data with pivot_longer()


  • The pivot_longer() function takes three key arguments
    • cols specifies the columns that need to be pivoted. Uses the same syntax as select()
    • names_to names the variable stored in the column names
    • values_to names the variable stored in the cell values
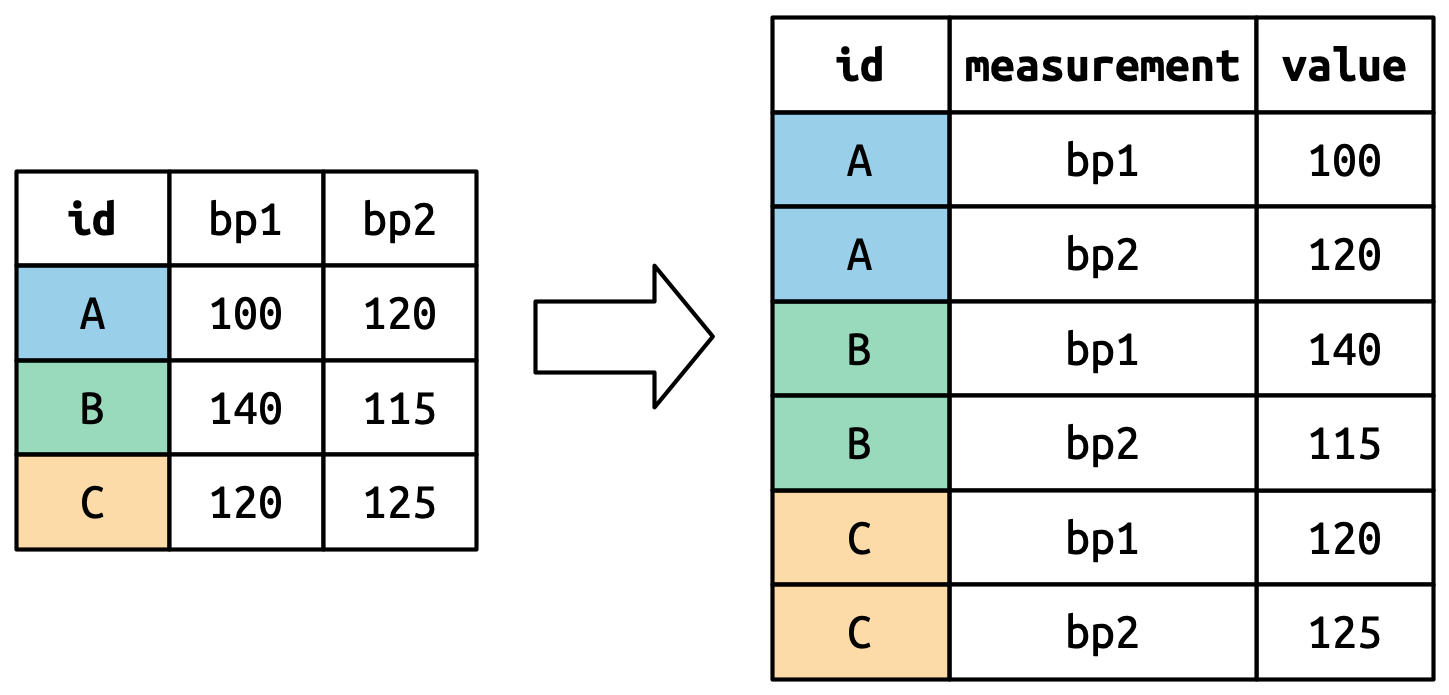
(a) Existing columns get repeated
(b) Names go to a new column
(c) Values are preserved, row by row
Figure 1: How does pivoting work?

Lengthening data with pivot_longer()


indometh_wide %>% 
  pivot_longer(
    cols = -Subject, #All except Subject
    names_to = "time", 
    values_to = "plasma_conc"
  )

#Alternatively
alt <- indometh_wide %>% 
  pivot_longer(
    cols = starts_with("t"), #All that start with letter "t"
    names_to = "time", 
    values_to = "plasma_conc"
  )
# A tibble: 66 × 3
   Subject time  plasma_conc
   <ord>   <chr>       <dbl>
 1 1       t0.25        1.5 
 2 1       t0.5         0.94
 3 1       t0.75        0.78
 4 1       t1           0.48
 5 1       t1.25        0.37
 6 1       t2           0.19
 7 1       t3           0.12
 8 1       t4           0.11
 9 1       t5           0.08
10 1       t6           0.07
# ℹ 56 more rows

Note

“time” and “plasma_conc” need to be in quotes because those are columns we are creating, they don’t exist yet in the dataset

Lengthening data with pivot_longer()


  • If we wanted to remove the extra “t” in the time column, we could use the parse_number() function
indometh_long <- 
  indometh_wide %>% 
  pivot_longer(
    cols = -Subject,
    names_to = "time", 
    values_to = "plasma_conc"
  ) %>% 
  mutate(time = parse_number(time))

Lengthening data with pivot_longer()


  • Now it would be much easier to plot the data with ggplot
indometh_long %>% 
  ggplot(aes(x = time, 
             y = plasma_conc, 
             color = Subject)) +
  geom_line() +
  theme_minimal()

Lengthening data with pivot_longer()


  • pivot_longer() can deal with multiple and more complex scenarios, such as:
    • Many variables in column names
    • Data and variable names in column headers

Note

You can explore these patterns in depth in the R for Data Science book

Widening data with pivot_wider()

  • The opposite of pivot_longer() is pivot_wider().
  • The pivot_wider() function takes two key arguments
    • names_from names the variable that will be converted into column names
    • values_from names the variable stored in the cell values
#Widening the subjects variable
Indometh %>% 
  pivot_wider(names_from = Subject,
              values_from = conc)
# A tibble: 11 × 7
    time   `1`   `2`   `3`   `4`   `5`   `6`
   <dbl> <dbl> <dbl> <dbl> <dbl> <dbl> <dbl>
 1  0.25  1.5   2.03  2.72  1.85  2.05  2.31
 2  0.5   0.94  1.63  1.49  1.39  1.04  1.44
 3  0.75  0.78  0.71  1.16  1.02  0.81  1.03
 4  1     0.48  0.7   0.8   0.89  0.39  0.84
 5  1.25  0.37  0.64  0.8   0.59  0.3   0.64
 6  2     0.19  0.36  0.39  0.4   0.23  0.42
 7  3     0.12  0.32  0.22  0.16  0.13  0.24
 8  4     0.11  0.2   0.12  0.11  0.11  0.17
 9  5     0.08  0.25  0.11  0.1   0.08  0.13
10  6     0.07  0.12  0.08  0.07  0.1   0.1 
11  8     0.05  0.08  0.08  0.07  0.06  0.09

Widening data with pivot_wider()


  • Widening data could make sense at the end of a pipeline, for display purposes
library(kableExtra)

Indometh %>% 
  pivot_wider(names_from = Subject,
              values_from = conc) %>% 
  kableExtra::kbl() %>% 
  kableExtra::kable_styling(font_size = 14) %>% 
  kableExtra::kable_classic_2()
time 1 2 3 4 5 6
0.25 1.50 2.03 2.72 1.85 2.05 2.31
0.50 0.94 1.63 1.49 1.39 1.04 1.44
0.75 0.78 0.71 1.16 1.02 0.81 1.03
1.00 0.48 0.70 0.80 0.89 0.39 0.84
1.25 0.37 0.64 0.80 0.59 0.30 0.64
2.00 0.19 0.36 0.39 0.40 0.23 0.42
3.00 0.12 0.32 0.22 0.16 0.13 0.24
4.00 0.11 0.20 0.12 0.11 0.11 0.17
5.00 0.08 0.25 0.11 0.10 0.08 0.13
6.00 0.07 0.12 0.08 0.07 0.10 0.10
8.00 0.05 0.08 0.08 0.07 0.06 0.09

Importing

data to R

Importing data to R


  • There are many data sources that R can read data from (e.g. Databases, JSON, geo data, …)
  • We will focus on tabular data. For most small scale projects, you will import data from:
    • Spreadsheets (csv, xls, xlsx, txt, google sheets)
    • Statistical software (spss, stata, sas)
  • Tidyverse packages include
    • readr (txt, csv, tsv)
    • readxl (xls, xlsx)
    • haven (spss, sas, stata)
  • Unsupported file formats (check supported formats here)

Importing data to R


One {rio} to rule them all!

rio::import("filepath/filename.ext")


And that’s it…

Importing data to R


And for exporting

One {rio} to rule them all!

rio::export(my_awesome_object, "filepath/my_aesome_object.csv")
rio::export(my_awesome_object, "filepath/my_aesome_object.xlsx")
rio::export(my_awesome_object, "filepath/my_aesome_object.sav")
rio::export(my_awesome_object, "filepath/my_aesome_object.dta")
rio::export(my_awesome_object, "filepath/my_aesome_object.rds")
...


Choose whatever file type you want
And that’s it.

When may {rio} not be enough?

  • With Excel
    • Import from file with multiple sheets
    • Import multiple ranges separately
    • read_excel() function from {readxl} has you covered
  • With sources that may require authentication (e.g. googlesheets, onedrive)
    • Specific packages for these purposes (e.g. {googlesheets4})

Encoding hell


  • Sometimes when importing non-english text data you will get errors on characters such as ã, ô, ç, …
  • ASCII (American Standard Code for Information Interchange) encoding, for example, does not include accented characters.
  • Latin1 (aka ISO-8859-1) was used for Western European languages, and you may still find datasets with this encoding.
  • The most likely source of such errors are encoding differences.

Encoding hell


Important

The default encoding used almost everywhere today is UTF-8.

When encountering strange, unexpected, characters in text data one of the first thing you should think about are encoding differences!

When naming things (variables, files, folders, …), avoid non-english characters to save you trouble down the line!

  • RStudio allows you to open R scripts with a specific encoding, when it’s different from the default.

Learning how to learn

  • Check the function documentation and examples
  • Check the package vignettes and articles
  • Google it!
    • You will likely end up on Stackoverflow
  • ChatGPT
    • Useful, but beware of allucinations (e.g. functions or packages that do not exist)

Learning how to learn

Tip

When googling, ask for tidyverse solutions:
An example:
What you want to know: How to filter only observations that have the pattern “abc” in the “Name” variable, in a dataframe called “my_awesome_dataframe”
What you would ask: “Tidyverse how to filter observations that have a specific pattern”
What you would ask: “Tidyverse how to filter observations based on a substring”

Google the idea/pattern (filtering rows based on a substring of text), instead of the specific pattern that you are looking for.

Some useful

functions and

patterns

Making numbers from text


x <- c("$1,234", "EUR 9,876", "0.5g/l")
parse_number(x)
[1] 1234.0 9876.0    0.5

Rounding numbers


  • Very useful when plotting or displaying data in a table
  • Scales package works neatly with ggplot with functions label_*
library(scales)

many_decimals <- c(1.13435435, 3.1415926)
many_decimals %>% scales::number(accuracy = 0.01)
[1] "1.13" "3.14"

Cutting numbers into ranges


ages <- seq(0,100)
head(ages)
[1] 0 1 2 3 4 5
ages %>% cut_interval(length = 5) %>% unique()
 [1] [0,5]    (5,10]   (10,15]  (15,20]  (20,25]  (25,30]  (30,35]  (35,40] 
 [9] (40,45]  (45,50]  (50,55]  (55,60]  (60,65]  (65,70]  (70,75]  (75,80] 
[17] (80,85]  (85,90]  (90,95]  (95,100]
20 Levels: [0,5] (5,10] (10,15] (15,20] (20,25] (25,30] (30,35] ... (95,100]

What if we wanted to store the results in a tibble, with the columns “age” and “age_groups”, and have a group “85+” for all the ages >85?

age_groups_df <- ages %>% 
  as_tibble() %>% 
  rename(age = value) %>% 
  mutate(age_groups = cut_interval(ages, length = 5)) %>% 
  mutate(age_groups = fct_collapse(age_groups, 
                                   "85+" = c("(85,90]", "(90,95]", "(95,100]")))
#With fct_collapse we can specify a group that we want to create based on other levels, 
#and all the other groups remain the same

#Alternatively
age_groups_df <- ages %>% 
  as_tibble() %>% 
  rename(age = value) %>% 
  mutate(age_helper = ifelse(age>85,86,age)) %>% 
  mutate(age_groups = cut_interval(age_helper, length = 5)) %>% 
  mutate(age_groups = if_else(age_groups == "(85,90]",
                              factor("85+"),
                              age_groups))
#In this approach we are converting all values greater than 85 to a value
#in that range, so that the cut_interval only generated one extra group,
#that can then be converted to the desired format with if_else

Offset values

  • Useful to calculate variations with regularly intervaled data (e.g. year-over-year changes)
  • The lag(value, n) functions searches for the value in the same col, n rows above
  • If the dataset is properly arranged/sorted, this pattern can be used to calculate change in time series datasets
#A dataset with monthly values for Portugal and World
df %>% glimpse()
Rows: 96
Columns: 4
$ year       <int> 2020, 2020, 2020, 2020, 2020, 2020, 2020, 2020, 2020, 2020,…
$ month      <int> 1, 1, 2, 2, 3, 3, 4, 4, 5, 5, 6, 6, 7, 7, 8, 8, 9, 9, 10, 1…
$ region     <chr> "Portugal", "World", "Portugal", "World", "Portugal", "Worl…
$ some_value <dbl> 1.53070845, 1.24319833, -0.71736323, -0.61063213, 0.1250573…

Offset values

  • The lag(value, n) functions searches for the value, n rows above
  • The lead(value, n) functions searches for the value, n rows below
#Calculating Year-over-Year (YoY) changes (e.g. yoy = 12/2023 - 12/2022)
df %>% 
  arrange(region,year,month) %>% 
  group_by(region) %>% 
  mutate(yoy = some_value - lag(some_value,12)) %>% 
  glimpse()
Rows: 96
Columns: 5
Groups: region [2]
$ year       <int> 2020, 2020, 2020, 2020, 2020, 2020, 2020, 2020, 2020, 2020,…
$ month      <int> 1, 2, 3, 4, 5, 6, 7, 8, 9, 10, 11, 12, 1, 2, 3, 4, 5, 6, 7,…
$ region     <chr> "Portugal", "Portugal", "Portugal", "Portugal", "Portugal",…
$ some_value <dbl> 1.53070845, -0.71736323, 0.12505738, -0.49000543, 0.0203951…
$ yoy        <dbl> NA, NA, NA, NA, NA, NA, NA, NA, NA, NA, NA, NA, -0.7213474,…

Strings

str_* family of functions with {stringr}

  • There are some relevant functions to deal with strings
#Dataset from the gapminder package
country_codes %>% glimpse
Rows: 187
Columns: 3
$ country   <chr> "Afghanistan", "Albania", "Algeria", "Angola", "Argentina", …
$ iso_alpha <chr> "AFG", "ALB", "DZA", "AGO", "ARG", "ARM", "ABW", "AUS", "AUT…
$ iso_num   <int> 4, 8, 12, 24, 32, 51, 533, 36, 40, 31, 44, 48, 50, 52, 112, …
#Countries that start with P
country_codes %>% 
  filter(str_starts(country,"P")) %>% 
  glimpse()
Rows: 9
Columns: 3
$ country   <chr> "Pakistan", "Panama", "Papua New Guinea", "Paraguay", "Peru"…
$ iso_alpha <chr> "PAK", "PAN", "PNG", "PRY", "PER", "PHL", "POL", "PRT", "PRI"
$ iso_num   <int> 586, 591, 598, 600, 604, 608, 616, 620, 630

str_* family of functions with {stringr}

  • A few examples of relevant functions to deal with strings
#Countries that contain "gal"
country_codes %>% 
  filter(str_detect(country,"gal"))
# A tibble: 2 × 3
  country  iso_alpha iso_num
  <chr>    <chr>       <int>
1 Portugal PRT           620
2 Senegal  SEN           686
#Replace all capital "A" with "!"
country_codes %>%
  mutate(country = str_replace_all(country, "A","!")) %>% 
  glimpse()
Rows: 187
Columns: 3
$ country   <chr> "!fghanistan", "!lbania", "!lgeria", "!ngola", "!rgentina", …
$ iso_alpha <chr> "AFG", "ALB", "DZA", "AGO", "ARG", "ARM", "ABW", "AUS", "AUT…
$ iso_num   <int> 4, 8, 12, 24, 32, 51, 533, 36, 40, 31, 44, 48, 50, 52, 112, …

str_* family of functions with {stringr}

  • A few examples of relevant functions to deal with strings
#Replace all "a" or "A" with "!"
country_codes %>%
  mutate(country = str_replace_all(country, regex("a", ignore_case=T), "!")) %>% 
  glimpse()
Rows: 187
Columns: 3
$ country   <chr> "!fgh!nist!n", "!lb!ni!", "!lgeri!", "!ngol!", "!rgentin!", …
$ iso_alpha <chr> "AFG", "ALB", "DZA", "AGO", "ARG", "ARM", "ABW", "AUS", "AUT…
$ iso_num   <int> 4, 8, 12, 24, 32, 51, 533, 36, 40, 31, 44, 48, 50, 52, 112, …

str_* family of functions with {stringr}

  • A few examples of relevant functions to deal with strings
#Split the character every time you find the letter "n"
country_codes$country %>% str_split("n") %>% head(10)
[[1]]
[1] "Afgha" "ista"  ""     

[[2]]
[1] "Alba" "ia"  

[[3]]
[1] "Algeria"

[[4]]
[1] "A"    "gola"

[[5]]
[1] "Arge" "ti"   "a"   

[[6]]
[1] "Arme" "ia"  

[[7]]
[1] "Aruba"

[[8]]
[1] "Australia"

[[9]]
[1] "Austria"

[[10]]
[1] "Azerbaija" ""         
  • And many more…

separate_* family of functions

  • Sometimes a column contains multiple value
df <- tibble(year_month = c("2023-12", "2023-11", "2023-10"),
             name = c("Jon Snow", "Arya Stark", "Tyrion Lannister"),
             some_value = c(1,2,3))

df %>% glimpse
Rows: 3
Columns: 3
$ year_month <chr> "2023-12", "2023-11", "2023-10"
$ name       <chr> "Jon Snow", "Arya Stark", "Tyrion Lannister"
$ some_value <dbl> 1, 2, 3

separate_* family of functions

#Separate year_month into two columns, by position
df %>% separate_wider_position(year_month,
                widths = c(year = 4, 1, month = 2)) %>% 
  glimpse()
Rows: 3
Columns: 4
$ year       <chr> "2023", "2023", "2023"
$ month      <chr> "12", "11", "10"
$ name       <chr> "Jon Snow", "Arya Stark", "Tyrion Lannister"
$ some_value <dbl> 1, 2, 3
#Separate name into first and last names, by delimiter
df %>% separate_wider_delim(name,
                delim = " ",
                names = c("first_name","last_name")) %>% 
  glimpse()
Rows: 3
Columns: 4
$ year_month <chr> "2023-12", "2023-11", "2023-10"
$ first_name <chr> "Jon", "Arya", "Tyrion"
$ last_name  <chr> "Snow", "Stark", "Lannister"
$ some_value <dbl> 1, 2, 3

glue

  • Used to easily pass variables into strings
df <- tibble(year_month = c("2023-12", "2023-11", "2023-10"),
             name = c("Jon Snow", "Arya Stark", "Tyrion Lannister"),
             some_value = c(1,2,3))

df %>% glimpse
Rows: 3
Columns: 3
$ year_month <chr> "2023-12", "2023-11", "2023-10"
$ name       <chr> "Jon Snow", "Arya Stark", "Tyrion Lannister"
$ some_value <dbl> 1, 2, 3
df %>% mutate(text = (glue::glue("{name} had the value {some_value} in {year_month}")))
# A tibble: 3 × 4
  year_month name             some_value text                                   
  <chr>      <chr>                 <dbl> <glue>                                 
1 2023-12    Jon Snow                  1 Jon Snow had the value 1 in 2023-12    
2 2023-11    Arya Stark                2 Arya Stark had the value 2 in 2023-11  
3 2023-10    Tyrion Lannister          3 Tyrion Lannister had the value 3 in 20…

Factors wih

{forcats}

What is a factor

  • A factor is an integer vector with a levels attribute that stores a set of mappings between integers and categorical values.
  • So, stored as numbers but rendered as labels (similar to SPSS)

Creating factors

  • A character vector
some_char_vec
  [1] "Treatment" "Placebo"   "Placebo"   "Treatment" "Placebo"   "Placebo"  
  [7] "Placebo"   "Placebo"   "Placebo"   "Treatment" "Treatment" "Treatment"
 [13] "Treatment" "Treatment" "Treatment" "Treatment" "Placebo"   "Treatment"
 [19] "Placebo"   "Placebo"   "Treatment" "Placebo"   "Treatment" "Placebo"  
 [25] "Treatment" "Placebo"   "Treatment" "Placebo"   "Treatment" "Placebo"  
 [31] "Placebo"   "Placebo"   "Placebo"   "Treatment" "Placebo"   "Treatment"
 [37] "Treatment" "Placebo"   "Placebo"   "Treatment" "Treatment" "Placebo"  
 [43] "Placebo"   "Placebo"   "Placebo"   "Treatment" "Placebo"   "Placebo"  
 [49] "Treatment" "Placebo"   "Treatment" "Treatment" "Placebo"   "Placebo"  
 [55] "Placebo"   "Treatment" "Treatment" "Treatment" "Placebo"   "Placebo"  
 [61] "Placebo"   "Treatment" "Treatment" "Placebo"   "Treatment" "Treatment"
 [67] "Treatment" "Placebo"   "Treatment" "Placebo"   "Treatment" "Treatment"
 [73] "Placebo"   "Treatment" "Treatment" "Treatment" "Treatment" "Treatment"
 [79] "Placebo"   "Treatment" "Treatment" "Placebo"   "Treatment" "Treatment"
 [85] "Treatment" "Placebo"   "Placebo"   "Placebo"   "Placebo"   "Placebo"  
 [91] "Treatment" "Treatment" "Treatment" "Placebo"   "Treatment" "Placebo"  
 [97] "Treatment" "Placebo"   "Treatment" "Placebo"  

Creating factors

  • At the bottom now we see Levels
  • This means that there are two possible unique values, with those labels: Placebo and Treatment
  • But R is storing them as numbers
#A vector with 100 cases of either treatment or placebo
some_factor_vec <- factor(some_char_vec)
some_factor_vec
  [1] Treatment Placebo   Placebo   Treatment Placebo   Placebo   Placebo  
  [8] Placebo   Placebo   Treatment Treatment Treatment Treatment Treatment
 [15] Treatment Treatment Placebo   Treatment Placebo   Placebo   Treatment
 [22] Placebo   Treatment Placebo   Treatment Placebo   Treatment Placebo  
 [29] Treatment Placebo   Placebo   Placebo   Placebo   Treatment Placebo  
 [36] Treatment Treatment Placebo   Placebo   Treatment Treatment Placebo  
 [43] Placebo   Placebo   Placebo   Treatment Placebo   Placebo   Treatment
 [50] Placebo   Treatment Treatment Placebo   Placebo   Placebo   Treatment
 [57] Treatment Treatment Placebo   Placebo   Placebo   Treatment Treatment
 [64] Placebo   Treatment Treatment Treatment Placebo   Treatment Placebo  
 [71] Treatment Treatment Placebo   Treatment Treatment Treatment Treatment
 [78] Treatment Placebo   Treatment Treatment Placebo   Treatment Treatment
 [85] Treatment Placebo   Placebo   Placebo   Placebo   Placebo   Treatment
 [92] Treatment Treatment Placebo   Treatment Placebo   Treatment Placebo  
 [99] Treatment Placebo  
Levels: Placebo Treatment

Modifying factors

  • Change the order with fct_relevel()
    • Useful for plotting
#Cjecking the levels
levels(some_factor_vec)
[1] "Placebo"   "Treatment"
#Changing the order of the levels
some_factor_vec %>% fct_relevel("Treatment","Placebo") %>% levels()
[1] "Treatment" "Placebo"  
#Relabel to lower case
some_factor_vec %>% fct_recode(new_name_treatment = "Treatment", new_name_placebo = "Placebo") %>% levels
[1] "new_name_placebo"   "new_name_treatment"
#Apply a function to all levels. Eg. convert to upper case
some_factor_vec %>% fct_relabel(str_to_upper) %>% levels
[1] "PLACEBO"   "TREATMENT"

Dates and times

Creating and formating dates

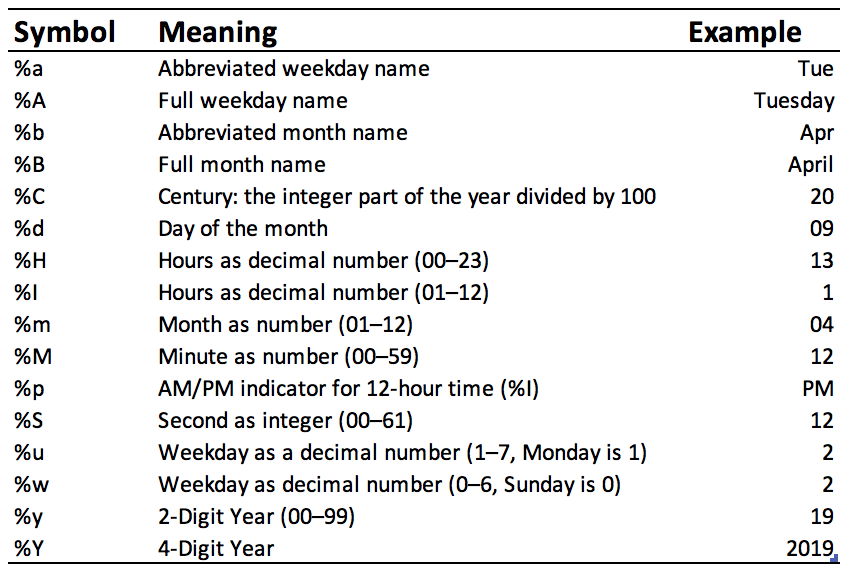
  • Create a date with as.Date() function
  • The default date pattern is year, month, day
    • e.g. 2023-11-20, or 2023/11/20
as.Date("2023/11/20")
[1] "2023-11-20"
as.Date("20-11-2023") #No error! But not what we wanted
[1] "0020-11-20"
as.Date("20-11-2023", format = "%d-%m-%Y")
[1] "2023-11-20"
as.Date("20/Nov/23", format = "%d/%b/%y")
[1] "2023-11-20"

Important

Sometimes when trying to create a data R thinks it has a valid format and creates a date that is not what we want.

Creating and formating dates

Useful patterns

and functions

set.seed

  • Using set.seed() before a calculation that uses generated (pseudo-) random values will yield the same results
  • This is true as long as the same random generations are called in the same order after set seed!
set.seed(12345)
runif(20)
 [1] 0.720903896 0.875773193 0.760982328 0.886124566 0.456480960 0.166371785
 [7] 0.325095387 0.509224336 0.727705254 0.989736938 0.034535435 0.152373490
[13] 0.735684952 0.001136587 0.391203335 0.462494654 0.388143982 0.402485142
[19] 0.178963585 0.951658754

iconv translitt

  • This pattern is useful to remove accented characters from latin character strings
iconv("Mação", to='ASCII//TRANSLIT', sub='')
[1] "Macao"

excel_numeric_to_date()

  • Excel treats dates as numbers, with 1 being 1st of January 1900
  • Sometimes when importing to R the value will be loaded as a number
my_excel_date_number <-45251 #20-11-2023
my_excel_date_number %>% janitor::excel_numeric_to_date()
[1] "2023-11-21"

Exercises